Upload presentasi
Presentasi sedang didownload. Silahkan tunggu

1
Rheological properties Thermal properties Microstructure
Analisis Sifat Fisik Rheological properties Thermal properties Microstructure

2
Pengertian rheology Rheologi adalah ilmu yang mempelajari sifat aliran dan perubahan bentuk (deformasi) suatu bahan akibat adanya pengaruh gaya mekanis yang mengenainya.
 suatu bahan akibat adanya pengaruh gaya mekanis yang mengenainya.")
3
Why we want to study rheology of Foods?
Disain atau pemilihan peralatan pompa, line pipa, ekstruder, mixer, heat exchanger, dll. Perilaku rheologi berhubungan erat dengan tekstur dan data sensori Untuk menentukan fungsionalitas ingridiens dalam pengembangan produk Pengujian umur simpan

4
Rheological properties
Produk pangan ada yang berbentuk cair, semi-padat dan padat yang tentunya memiliki sifat reologi yang berbeda-beda Produk pangan cair bervariasi tingkat kekentalan dan sifat mengalirnya: cair encer dan mudah mengalir atau cair yang kental dan lebih sulit mengalir. Produk semi-padat memiliki sifat di antara sifat cair dan padat: mentega/margarin, selai kacang (peanut butter), dodol dan agar-agar
, dodol dan agar-agar.")
5
Rheological properties
Produk pangan padat tidak memiliki sifat kekentalan dan aliran: biskuit, potato chips, kerupuk, dll. Produk padat apabila diberikan gaya mekanis tertentu baik ditekan atau ditarik, akan mengalami patah. Untuk produk berbentuk padat, sifat reologi yang diukur biasanya adalah kekerasan (hardness), kemudahan patah (fracturability), elasticity, dsb.
, kemudahan patah (fracturability), elasticity, dsb.")
6
Fluid Foods FLUIDA : Senyawa/bahan yang dapat mengalir tanpa mengalami “disintegrasi” jika dikenakan tekanan kepada bahan tersebut. FLUIDA : GAS CAIRAN PADATAN Karakteristik Aliran ………………> REOLOGI

7
Karakteristik Fluida Densitas : massa per satuan volume SI : kg.m-3
Lainnya : lbm.ft-3 g.cc-1 atau g.cm-3 Kompresabilitas : Perubahan densitas fluida karena perubahan suhu atau tekanan - sangat penting untuk gas - dapat diabaikan untuk cairan Viskositas ?

8
Batasan Viskositas fluida Perhatikan dua silinder Konsentrik :
Silinder dalam : BERGERAK/BERPUTAR Silinder luar : DIAM fluida Fluida terdapat diantara dua tabung F y V = 0 (diam) Untuk tetap mempertahankan aliran, diperlukan gaya = F Kemudahan mengalir? dV/dy? V = f (F, A, sifat fluida) y
 Untuk tetap mempertahankan aliran, diperlukan gaya = F. Kemudahan mengalir dV/dy V = f (F, A, sifat fluida) y.")
9
Batasan Viskositas dy dV A F ÷ ø ö ç è æ - m = Luas = A F V=f(y)
Kemudahan mengalir? DV/Dy? V = f (F, A, sifat fluida) VISKOSITAS () Suatu ukuran mudah/sukarnya suatu bahan untuk mengalir dy dV A F ÷ ø ö ç è æ - m = = t
 VISKOSITAS () Suatu ukuran mudah/sukarnya suatu bahan untuk mengalir. dy. dV. A. F. ÷ ø. ö. ç. è. æ. - m. = = t.")
10
Pengukuran Viskositas Dengan Rotational viscometer
Untuk mengukur kekentalan dan sifat aliran suatu cairan Didasarkan pada gaya rotasi oleh spindle yang diatur kecepatan putarnya. Diameter dan bentuk spindle berbeda-beda yang biasanya diberi nomor #1, #2, #3, dst Torque: Persen terhadap maksimum kecepatan rotasi dari spindle. 100%: spindle berputar pada kecepatan maksimumnya, 0%: spindle dalam keadaan diam.

11
Faktor untuk Brookfield model LV Kecepatan rotasi (rpm)
(spindle #3) Kecepatan rotasi (rpm) Faktor 0,3 0,6 1,5 3 6 12 30 60 4000 2000 800 400 200 100 40 20 Contoh: Bila suatu cairan dilakukan pengukuran viskositas pada kecepatan rotasi 6 rpm dengan spindle #3, nilai torque yang terbaca adalah 40.6%. Dengan demikian, nilai viskositas adalah 40.6%*200 = 8120 mPa.s = 8.12 Pa.s.
 Kecepatan rotasi (rpm) Faktor. 0,3. 0,6. 1, Contoh: Bila suatu cairan dilakukan pengukuran viskositas pada kecepatan rotasi 6 rpm dengan spindle #3, nilai torque yang terbaca adalah 40.6%. Dengan demikian, nilai viskositas adalah 40.6%*200 = 8120 mPa.s = 8.12 Pa.s.")
12
Viskositas [=] g cm-1det-1 = poise Note : 1 poise = 100 cp Contoh:
air (20oC, 1 atm) = cp air (80oC, 1 atm) = cp udara (20oC, 1 atm) = cp C2H5OH (lq; 20oC, 1 atm) = cp H2SO4 (lq; 25oC, 1 atm) = cp glycerol (lq; 20oC, 1 atm) = 1069 cp
![Viskositas [=] g cm-1det-1 = poise Note : 1 poise = 100 cp Contoh:](http://slideplayer.info/slide/2860961/10/images/12/Viskositas+%EF%81%AD+%5B%3D%5D+g+cm-1det-1+%3D+poise+Note+%3A+1+poise+%3D+100+cp+Contoh%3A.jpg "air (20oC, 1 atm) = cp. air (80oC, 1 atm) = cp. udara (20oC, 1 atm) = cp. C2H5OH (lq; 20oC, 1 atm) = cp. H2SO4 (lq; 25oC, 1 atm) = cp. glycerol (lq; 20oC, 1 atm) = 1069 cp.")
13
Newtonian and Non-Newtonian Foods
Newtonian foods: bahan yang nilai kekentalannya tidak diperngaruhi oleh besarnya gaya yang mengalirkan atau menggerakkannya Non-Newtonian foods: nilai kekentalan akan sangat dipengaruhi oleh gaya yang diberikan Gambar 8.2. Pengaruh gaya pengadukan terhadap nilai kekentalan untuk cairan Newtonian dan non-Newtonian

14
Hubungan antara gaya geser vs
Hubungan antara gaya geser vs. laju geser (gradien kecepatan) untuk fluida newtonian dan non-newtonian Mayonaisse, margarin Newtonian Dilatant Pseudo-plastic Bingham plastic to t - dv/dy = g Krim, puree, salad dressing Tomato paste Suspensi pati, jem sirup gula (encer) air susu, sari buah Bingham Pseudo-plastic = shear stress (dyne/cm2) = shear rate (1/sec)
 untuk fluida newtonian dan non-newtonian. Mayonaisse, margarin. Newtonian. Dilatant. Pseudo-plastic. Bingham plastic. to. t. - dv/dy = g. Krim, puree, salad dressing. Tomato paste. Suspensi pati, jem. sirup gula (encer) air susu, sari buah. Bingham Pseudo-plastic. = shear stress (dyne/cm2) = shear rate (1/sec)")
15
Newtonian Foods Examples: Water Milk Vegetable oils Fruit juices
Shear stress Shear rate Examples: Water Milk Vegetable oils Fruit juices Sugar and salt solutions

16
Pseudoplastic (Shear thinning) Foods
Shear stress Shear rate Examples: Applesauce Banana puree Orange juice concentrate Oyster sauce CMC solution

17
Dilatant (Shear thickening) Foods
Shear stress Shear rate Examples: Liquid Chocolate 40% Corn starch solution

18
Bingham Plastic Foods Examples: Tooth paste Tomato paste Shear stress
Shear rate Examples: Tooth paste Tomato paste

19
Importance of yield stress
When stress is less than yield stress, material does not flow. It behaves like a solid Important for development of materials like butter, yogurt, cheese spread

20
Examples and characteristics of Newtonian and non-Newtonian foods
Viscosity type Characteristics and Food Examples Newtonian Viscosity is not affected by changes in shear rate and remains constant. Examples: water, fruit juice, carbonated beverages, milk, vegetable oils Bingham plastic A certain shear stress (called the yield stress) is required to initiate flow; once flow starts, shear rate has no effect. Example: tomato paste, Bingham pseudoplastic A yield point must be achieved to cause product flow, at which point pseudoplastic, behavior is observed. Examples: mayonnaise, margarine pseudoplastic “Shear thinning” fluids decrease in viscosity as shear rate increases. Examples: applesauce, banana puree, orange juice concentrate, guar and xanthan gum thickened products dilatant “Shear thickening” fluids increase in viscosity as shear rate increases. Examples: corn starch suspensions, chocolate syrups
 is required to initiate flow; once flow starts, shear rate has no effect. Example: tomato paste, Bingham pseudoplastic. A yield point must be achieved to cause product flow, at which point pseudoplastic, behavior is observed. Examples: mayonnaise, margarine. pseudoplastic. Shear thinning fluids decrease in viscosity as shear rate increases. Examples: applesauce, banana puree, orange juice concentrate, guar and xanthan gum thickened products. dilatant. Shear thickening fluids increase in viscosity as shear rate increases. Examples: corn starch suspensions, chocolate syrups.")
21
. VISKOSITAS = f(g)? Dapat pula digunakan viskositas apparent (mapp) t
m app = m Newtonian t Non-newtonian m app = = Kgn-1 g mapp g Dilatant : shear thickening Newtonian Pseudoplastik : Shear thinning

22
Why Shear Thinning occurs
Unsheared Sheared Aggregates break up Anisotropic Particles align with the Flow Streamlines In the same form as the cube used to define the other terms of stress and strain, we see a change in the molecules or particles/aggregates as shear is applied the result is a lower energy dissipation, so the viscosity drops when the sample is back at rest, then Brownian motion randomises the particles over time to rebuild the viscosity. if the rebuild process is slow enough then the sample is said to be thixotropic [time dependant] Random coil Polymers elongate and break Courtesy: TA Instruments

23
Shear Thinning Behavior
Shear thinning behavior is often a result of: Orientation of non-spherical particles in the direction of flow. An example of this phenomenon is the pumping of fiber slurries. Orientation of polymer chains in the direction of flow and breaking of polymer chains during flow. An example is polymer melt extrusion Deformation of spherical droplets to elliptical droplets in an emulsion. An industrial application where this phenomenon can occur is in the production of low fat margarine. Breaking of particle aggregates in suspensions. An example would be stirring paint. Courtesy: TA Instruments

24
VISKOSITAS = f(t)? Rheopektik: coklat, suspensi pati mapp t, waktu Time independent Thixotropik: madu, gum

25
Non-Newtonian 1 t g t= K (g )n ...............> model “Power law”
n : Indeks tingkah laku aliran (flow behavior index) K : Indeks konsistensi (consistency index) Pseudoplastik (n<1) A. Newtonian t = m (g ), model “power law” dgn K= dan n=1 . Newtonian (n=1) t Dilatan (n>1) B. Pseudoplastik t= K(g )n, n<1 . C. Dilatan t= K(g )n, n>1 . g . = shear stress ( dyne/cm2) = shear rate (1/sec)
 K : Indeks konsistensi (consistency index) Pseudoplastik (n<1) A. Newtonian. t = m (g ), model power law dgn K= dan n=1. . Newtonian (n=1) t. Dilatan (n>1) B. Pseudoplastik. t= K(g )n, n<1. . C. Dilatan. t= K(g )n, n>1. . g. . = shear stress ( dyne/cm2) = shear rate (1/sec)")
26
Non-Newtonian . t= to + K (g)n > model “Herschel-Bulkley” 2 K : Indeks tingkah laku aliran (flow behavior index) n : Indeks konsistensi (consistency index) to : gaya geser awal (yield stress) H - B A. Bingham plastik t = to + K(g); n = 1 t g . Bingham Plastik B. Fluida H - B t= to + K(g)n; n<1 . to = shear stress ( dyne/cm2) = shear rate (1/sec)
 to : gaya geser awal (yield stress) H - B. A. Bingham plastik. t = to + K(g); n = 1. t. g. . Bingham Plastik. B. Fluida H - B. t= to + K(g)n; n<1. . to. = shear stress ( dyne/cm2) = shear rate (1/sec)")
27
Pengukuran Sifat Aliran Dengan Rotational Viscometer
t= K (g )n > model “Power law” Gunakan: Shear stress dihitung dengan rumus berikut: = A 1 R 2RL Shear rate dihitung dengan rumus berikut: = 2RN
n > model Power law Gunakan: Shear stress dihitung dengan rumus berikut: = A 1. R 2RL. Shear rate dihitung dengan rumus berikut: = 2RN ")
28
Rotational Viscometer

29
Prosedur Analisis Gunakan spindle silinder atau plate. Untuk spindle berbentuk silinder, dapat dilengkapi dengan thermo jacket housing untuk meletakkan sampel. Thermo jacket housing ini dihubungkan dengan thermostatic circulator, sehingga suhu sampel dapat konstan. Dengan menggunakan thermo jacket housing ini, gap () antara dinding spindle dengan dinding jacket cukup kecil, sehingga jumlah sampel yang diukur pun sedikit (maksimum 16 ml).
 antara dinding spindle dengan dinding jacket cukup kecil, sehingga jumlah sampel yang diukur pun sedikit (maksimum 16 ml).")
30
Prosedur Analisis Pada alat ini data shear stress dan shear rate bisa langsung diperoleh, sehingga data yang dikumpulkan dapat diperoleh dengan menggunakan persamaan model Power law. Untuk menentukan apakah terdapat yield stress, maka model Herchel-Bulkley dapat digunakan. Nilai viskositas apparent (dalam mPa) dapat ditentukan pada shear rate tertentu, dimana nilainya dapat dihitung dengan menggunakan rumus : =/*100 (pengali 100 adalah untuk mengkonversi nilai Pa menjadi mPa).
 dapat ditentukan pada shear rate tertentu, dimana nilainya dapat dihitung dengan menggunakan rumus : =/*100 (pengali 100 adalah untuk mengkonversi nilai Pa menjadi mPa).")
31
Viscometer indicator reading (% full scale)
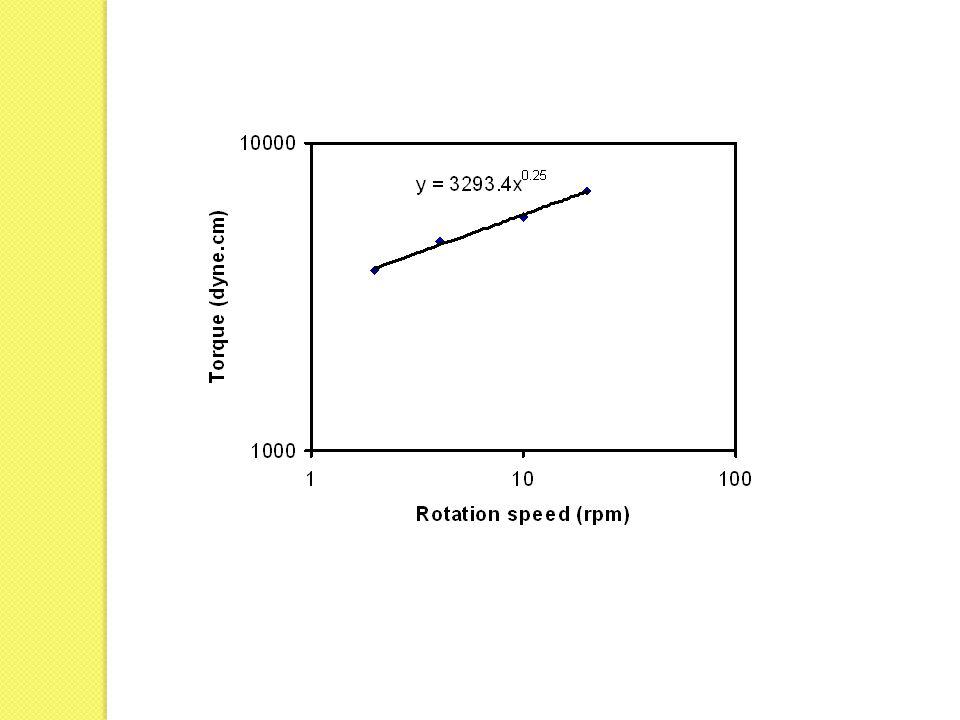
Contoh Kasus Brookfield viscometer digunakan untuk menentukan viskositas apparent dari saus tomat. Spindle yang digunakan adalah spindle #4 yang mengukur sampel pada 4 kecepatan rotasi, yaitu 2, 4, 10 dan 20 rpm. Diperoleh pembacaan torque yang dinyatakan sebagai persentasi terhadap skala penuh (% full scale) (lihat tabel). Konstanta viskometer untuk spindle #4 tersebut adalah 7187 dyne/cm (full scale). Tentukan indeks tingkah laku aliran (n). Kec. rotasi (rpm) Viscometer indicator reading (% full scale) Torque (dyne-cm) (% full scale*7187) 2 4 10 20 53.5 67 80.5 97 3845 4815 5786 6971
 (lihat tabel). Konstanta viskometer untuk spindle #4 tersebut adalah 7187 dyne/cm (full scale). Tentukan indeks tingkah laku aliran (n). Kec. rotasi (rpm) Viscometer indicator reading (% full scale) Torque (dyne-cm) (% full scale*7187)")
33
Kecepatan rotasi (rpm) Viscometer indicator reading (% full scale)
Contoh Viskometer rotasi yang memiliki konstanta spindle silinder dengan dyne/cm pada skala penuh digunakan untuk mengukur cairan. Spindle (diameter 1 cm, panjang 6 cm) dimasukkan ke dalam thermo jacket housing (dimater dalam 1.5 cm). Pembacaan dilakukan pada 4 kecepatan rotasi, yaitu 2, 4, 10 dan 20 rpm. Hasil pembacaan %torque (% full scale) adalah seperti pada tabel. Tentukanlah indeks tingkah laku aliran (n) dan indeks kekentalan (K). Kecepatan rotasi (rpm) Viscometer indicator reading (% full scale) 2 4 10 20 15 26 53 93
 dimasukkan ke dalam thermo jacket housing (dimater dalam 1.5 cm). Pembacaan dilakukan pada 4 kecepatan rotasi, yaitu 2, 4, 10 dan 20 rpm. Hasil pembacaan %torque (% full scale) adalah seperti pada tabel. Tentukanlah indeks tingkah laku aliran (n) dan indeks kekentalan (K). Kecepatan rotasi (rpm) Viscometer indicator reading (% full scale)")
34
= A = A = A/(0,52*2*6)= 0,106 A R 2RL R2(2L) = 2RN = 2*(0,5)*N/(1.5-1)(0,5)(60) = 0,2093N Kecepatan rotasi (N) (rpm) Viscometer indicator reading (% full scale) Torque (A) (dyne.cm) Shear rate (1/sec) Shear stress (dyne/cm2) 2 4 10 20 15 26 53 93 1078,05 1868,62 3809,11 6683,91 0,419 0,837 2,093 4,187 114,4 198,4 404,4 708,5 t= K (g )n > model “Power law” Gunakan: Submit jawaban anda ke:
 (rpm) Viscometer indicator reading (% full scale) Torque (A) (dyne.cm) Shear rate (1/sec) Shear stress (dyne/cm2) , , , ,91. 0,419. 0,837. 2,093. 4, ,4. 198,4. 404,4. 708,5. t= K (g )n > model Power law Gunakan: Submit jawaban anda ke:")
35
Instrument Control Brookfield viscometer

36
Choosing Spindle and Speed Brookfield viscometer

37
Taking a viscosity reading Brookfield viscometer

38
Unstable reading and Out of rang Brookfield viscometer

39
Aliran fluida dalam pipa
Jenis aliran Aliran laminar (streamline) Aliran turbulen Dipengaruhi oleh: Jenis fluida (Newtonian/non- Newtonian) Diameter pipa Densitas fluida Kecepatan aliran
 Aliran turbulen. Dipengaruhi oleh: Jenis fluida (Newtonian/non- Newtonian) Diameter pipa. Densitas fluida. Kecepatan aliran.")
40
Aliran laminar : ………… Re < 2100 Streamline/garis arus
Semua partikel yang memulai aliran di titik “A” akan mengikuti jejak yang sama, melalui B dan akhirnya C Berkas garis arus menun-jukkan arah aliran pada berbagai titik - hanya ada 1 komponen v Jejak “streamline” A B C Arah kecepatan partikel Jarak antar ”streamlines” memberikan indikasi ttg kecepatan fluida pada berbagai titik

41
Aliran turbulen …. Re > 2100 Pusaran
Semua partikel yang memulai aliran titik “A” tidak akan mengikuti jejak yang sama, melalui B dan akhirnya C Tidak ada streamline Terjadi mixing antar lapisan fluida Pada titik ttt : > 1 komponen kecepatan ARAH ALIRAN

42
Re = Dv/ PROFIL LAJU ALIRAN v 82 . ~ V v 10000, Re > NEWTONIAN ?
ALIRAN LAMINAR, Re < 2100 Vmax = 2 v ALIRAN TURBULEN, Re < 4000 Vmax = F (Re) Re = Dv/ 0.662 (Re) log 036 . V max + = where: =density (g/cm3) D=diameter of pipe (cm) v=Average velocity (cm/sec) µ= viscosity (poise) 82 . ~ V v 10000, Re max >
 Re = Dv/ (Re) log V. max. + = where: =density (g/cm3) D=diameter of pipe (cm) v=Average velocity (cm/sec) µ= viscosity (poise) ~ V. v , Re. max. >")
43
PROFIL LAJU ALIRAN dr dV K ÷ ø ö ç è æ = t 1 K v D Re ÷ ø ö ç è æ + r
K = consistency index n = flow behavior index D = Inner diameter of pipe V = average velocity = density Non - Newtonian ? dr dV K ÷ ø ö ç è æ = t n 3 2 G 1 K v D Re - ÷ ø ö ç è æ + r = Generalized Re ÷ ø ö ç è æ + = n 3 1 V v max Untuk aliran laminar:

44
Thermal Analysis

45
Different Techniques Dynamic Mechanical Analysis (DMA)
Viscoelastic Properties Differential Scanning Calorimetric (DSC) Heat flow during Transitions Thermal Gravimetric Analysis (TGA) Weight Loss due to decomposition Differential Thermal Analysis (DTA) Heat of Transitions
 Heat flow during Transitions. Thermal Gravimetric Analysis (TGA) Weight Loss due to decomposition. Differential Thermal Analysis (DTA) Heat of Transitions.")
46
DSC Thermogram > exothermic - Heat Flow Temperature Oxidation
Crystallisation Cross - Linking (Cure) > exothermic - Glass Transition Heat Flow Melting Temperature
 > exothermic. - Glass. Transition. Heat Flow. Melting. Temperature.")
47
What Can You Measure with DSC?
Qualitative analysis Fingerprinting of minerals, clays, polymers Sample purity Melting points Heat capacity, cp Glass transition temperature, Tg Crystallization temperature, Tc Phase diagrams

48
DSC: Main Sources of Errors
Calibration Contamination Sample preparation – how sample is loaded into a pan Residual solvents and moisture. Thermal lag Heating/Cooling rates Sample mass Processing errors

50
Schematic of DSC Instrument
Reference Sample T1 T2 Pt thermopile Pt thermopile Low mass 1 gram heater heater N2 flow DW

51
Glass Transition Step in thermogram
Transition from disordered solid to liquid Observed in glassy solids, e.g., polymers Tg, glass transition temperature Glass transition dH/dt, mJ/s Tg Temperature, K

52
Crystallization Sharp positive peak Disordered to ordered transition
Thermogram Sharp positive peak Disordered to ordered transition Material can crystallize! Observed in glassy solids, e.g., polymers Tc, crystallization temperature Crystallization dH/dt, mJ/s Tc Temperature, K

53
Melting Negative peak on thermogram Ordered to disordered transition
Tm, melting temperature NB: melting happens to crystalline polymers; glassing happens to amorphous polymers Thermogram Melting dH/dt, mJ/s Tm Temperature, K

54
Crystallization Sharp positive peak Disordered to ordered transition
Observed in glassy solids, e.g., polymers Tc, crystallization temperature dH/dt, mJ/s Tc Temperature, K

55
TGA

56
DTA TMA

57
Electron Microscopes The use of high energy electrons to examine the fine details of objects.

58
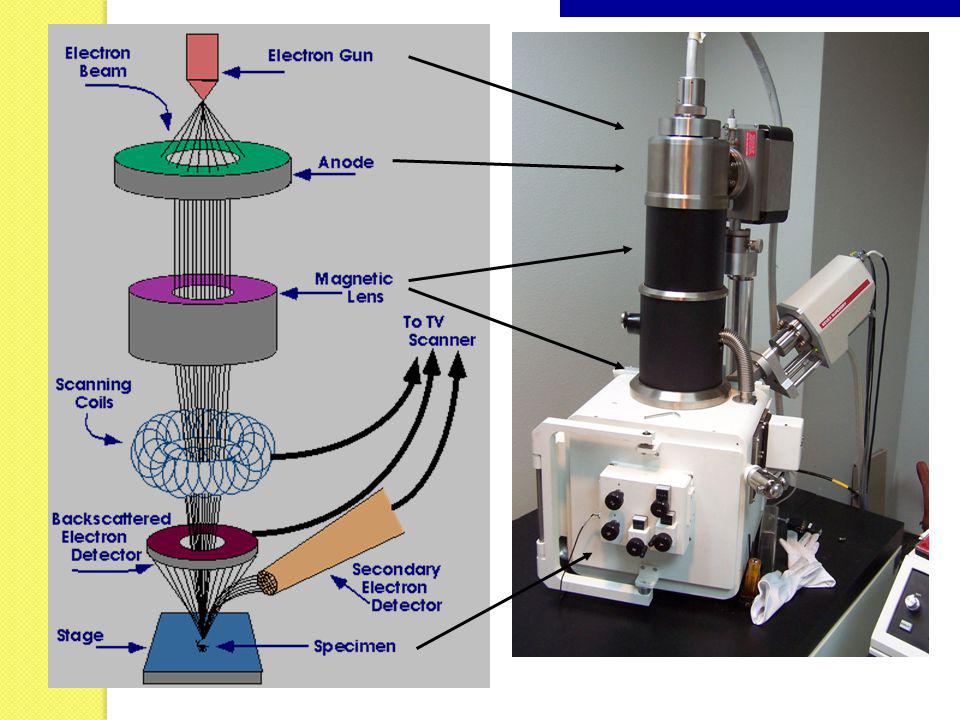
Scanning Electron Microscopy (SEM)
Merupakan alat untuk melihat mikrostruktur permukaan bahan Persiapan sampel mudah, kegunaan sangat luas Prinsip: Scanning sinar elektron primer di permukaan sampel yang kemudian mengalami eksitasi dan memancarkan elektron sekunder (krn ditembak dg electron beam)
")
60
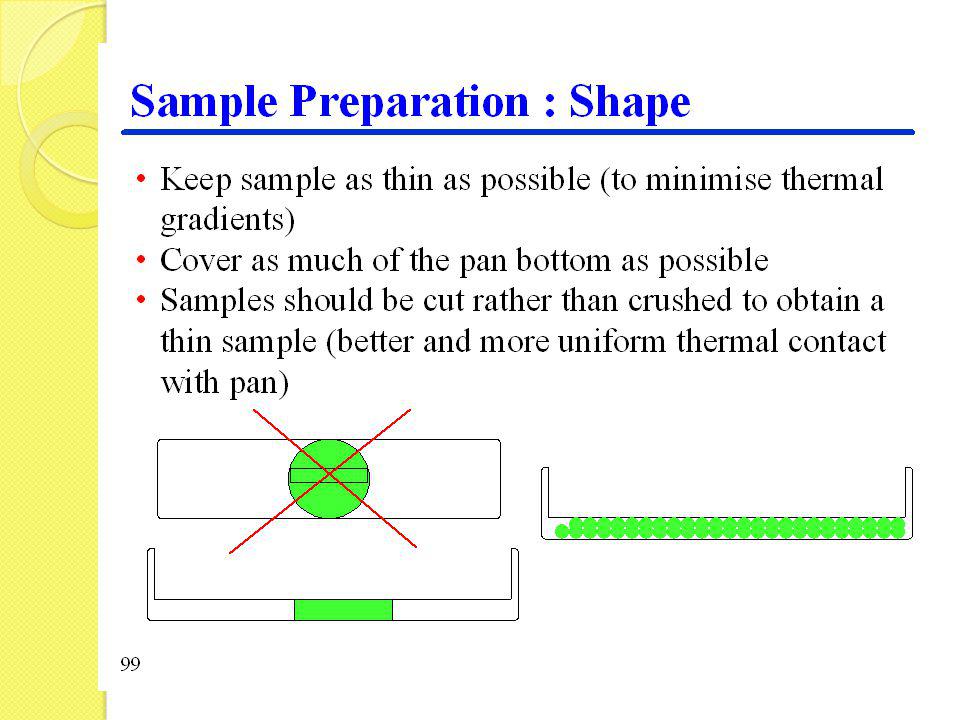
KOMPARASI MIKROSTRUKTUR KENTANG MENTAH DAN MASAK
SEM View of the Fracture Surface of Uncooked Potato Tissue. Starch granules are observed SEM View of the Fracture Surface of Cooked Potato Tissue. There is no starch granule

61
Diagram Showing Changes in Fracture Properties of
Plant Tissues as a Result of Heat Treatment

62
Modified sweet potato starch (HMT) Native sweet potato starch
 Native sweet potato starch")
Presentasi serupa