Upload presentasi
Presentasi sedang didownload. Silahkan tunggu

1
Kebisingan Industri

2
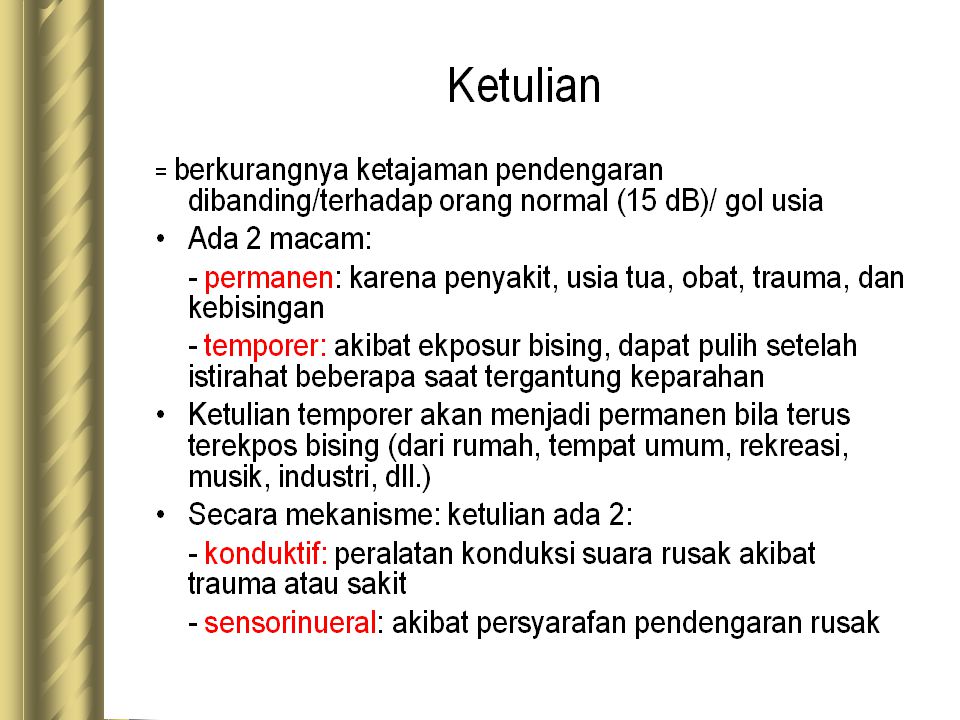
Definisi dan pengertian
Bising = suara-suara yang tidak dikehendaki Definisi secara ilmiah = sensasi yang diterima telinga sebagai akibat fluktuasi tekanan udara ‘superimposing’ tekanan atmosfir/udara yang steady Bising = sejenis vibrasi/energi yang dikonduksikan dalam media udara, cairan, padatan, tidak tampak, dan dapat memasuki telinga serta menimbulkan sensasi pada alat dengar

3
Inside NOISE What is noise? Why unwanted? Who are susceptible?
Definition, energy conducted and sensed, properties: intensity/pressure, frequency, exposure, Why unwanted? Health Effect, age, psychological: annoyed, concentration, rest/relax problem, communication annoyance, physiological: blood, heart, hearing loss, nausea, muscle control, acoustic trauma (permanent) vs temporary, Who are susceptible? Esp. Industrial workers, determining factors: sensitivity, age, How to evaluate & control?
 vs temporary, Who are susceptible Esp. Industrial workers, determining factors: sensitivity, age, How to evaluate & control")
4
What is noise? Definisi:
Suara-suara yang tidak dikehendaki (for Who? Why?) Suara: sensasi yang diterima telinga sebagai akibat fluktuasi tekanan udara terhadap tekanan udara yang stabil. Telinga akan merespons fluktuasi-fluktuasi kecil tersebut dengan sensitivitas yang sangat besar.
 Suara: sensasi yang diterima telinga sebagai akibat fluktuasi tekanan udara terhadap tekanan udara yang stabil. Telinga akan merespons fluktuasi-fluktuasi kecil tersebut dengan sensitivitas yang sangat besar.")
5
Properties of noise?

6
Karakteristik bising Intensitas/tekanan (sound pressure/intensity)
Frekuensi Durasi eksposur terhadap bising Ketiga karakteristik diperlukan karena: Semakin keras suara, semakin tinggi intensitasnya Frekuensi tinggi lebih berbahaya terhadap kemampuan dengar. Telinga manusia lebih sensitif terhadap frekuensi tinggi Semakin lama durasi eksposur semakin besar kerusakan pada mekanisme pendengaran

7
Jenis Bising Tergantung pada durasi dan frekuensi
Steady wide band noise, bising yang meliputi suatu jelajah frekuensi yang lebar (bising dalam ruang mesin) Steady narrow band noise, bising dari sebagian besar energi bunyi yang terpusat pada beberapa frekuensi saja, contoh gergaji bundar. Impact noise, kejutan singkat berulang, contoh riveting Intermitten noise, bising terputus, contoh lalu lintas pesawat
 Steady narrow band noise, bising dari sebagian besar energi bunyi yang terpusat pada beberapa frekuensi saja, contoh gergaji bundar. Impact noise, kejutan singkat berulang, contoh riveting. Intermitten noise, bising terputus, contoh lalu lintas pesawat.")
8
Contoh…

9
Tekanan = Sound Pressure
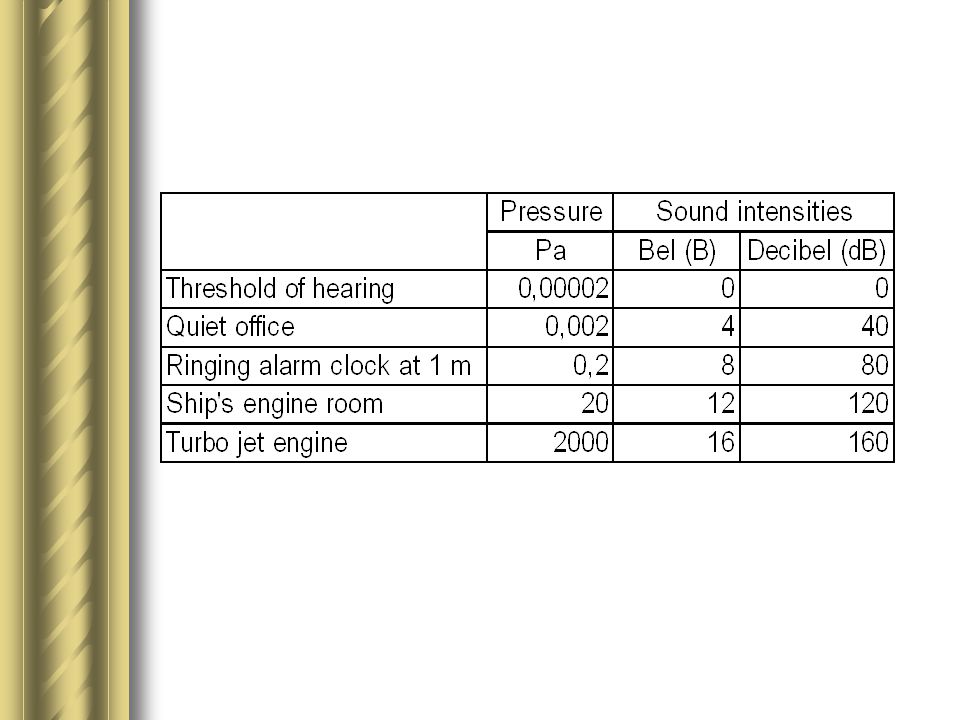
Manusia dapar mendengar suara pada tekanan antara 0,0002 dynes/cm2 (ambang dengar/threshold of hearing) sampai 2000 dynes/cm2 range besar sehingga satuan yang dipakai dB (decibel): logaritmik Dinyatakan dalam decibel (dB) yang dilengkapi skala A, B, dan C sesuai dengan berbagai kegunaan Skala A digunakan karena merupakan response yang paling cocok dengan telinga manusia (peka terhadap frekuensi tinggi) Skala B dan C untuk evaluasi kebisingan mesin, dan cocok untuk kebisingan frekuensi rendah
 sampai 2000 dynes/cm2 range besar sehingga satuan yang dipakai dB (decibel): logaritmik. Dinyatakan dalam decibel (dB) yang dilengkapi skala A, B, dan C. sesuai dengan berbagai kegunaan. Skala A digunakan karena merupakan response yang paling cocok dengan telinga manusia (peka terhadap frekuensi tinggi) Skala B dan C untuk evaluasi kebisingan mesin, dan cocok untuk kebisingan frekuensi rendah.")
10
Intensitas Laju aliran energi tiap satuan luas yang dinyatakan dalam desibell (dB) – Alexander Graham Bell- dB adalah merupakan satuan yang dihasilkan dari perhitungan yang membandingkan suatu tekanan suara yang terukur terhadap suatu tekanan acuan (sebesar 0,0002 dyne/cm2). B = log (int.terukur/int.acuan) untuk mendapatkan angka yang lebih akurat ditentukan dengan angka kelipatan 10 (desi) Intensity level dB=10 Log (IT/IA) Sound pressure level (tekanan bunyi) = 20 log (IT/IA), karena intensitas sebanding dengan kuadrat tekanan bunyi.
. B = log (int.terukur/int.acuan) untuk mendapatkan angka yang lebih akurat ditentukan dengan angka kelipatan 10 (desi) Intensity level dB=10 Log (IT/IA) Sound pressure level (tekanan bunyi) = 20 log (IT/IA), karena intensitas sebanding dengan kuadrat tekanan bunyi.")
11
Ruang kelas: ?dB Rumah Restauran Berbisik Berteriak Jet plane

12
The decibel SOUND INTENSITY SOUND SOURCE LINEAR UNITS Bel
LOGARITHMIC UNITS Decibel Lowest limit of hearing 1 0 0 Rustling leaf 10 1 10 Quiet farm setting 100 2 20 Whisper (5 feet) 1,000 3 30 Dripping faucet, quite office 10,000 4 40 Low conversation, residence 100,000 5 50 Ordinary conversation 1,000,000 6 60 Idling car 10,000,000 7 70 Silenced compressor, very noisy restaurant 100,000,000 8 80 Backhoe 1,000,000,000 9 90 Unsilenced compressor 10,000,000,000 Rock dril, woodworking 100,000,000,000 11 110 Pile driver* 1,000,000,000,000 12 120 Rivet gun* 10,000,000,000,000 13 130 Explosive-actuated tool*, jet plane 100,000,000,000,000 14 140 *Intermittent or "impulse" sound Source: Construction Safety Association of Ontario, Hearing Protection for the Construction Industry, 1985, page 3
 1, Dripping faucet, quite office. 10, Low conversation, residence. 100, Ordinary conversation. 1,000, Idling car. 10,000, Silenced compressor, very noisy restaurant. 100,000, Backhoe. 1,000,000, Unsilenced compressor. 10,000,000,000. Rock dril, woodworking. 100,000,000, Pile driver* 1,000,000,000, Rivet gun* 10,000,000,000, Explosive-actuated tool*, jet plane. 100,000,000,000, *Intermittent or impulse sound. Source: Construction Safety Association of Ontario, Hearing Protection for the Construction Industry, 1985, page 3.")
13
The decibel dB = 10 log10 (I1/I0) I = Intensitas
dB = 20 log10 (P1/P0) P= Tekanan = 0, dynes/cm2 SP (microbar) SPL (dB) Ratio Intensitas 0, 0, Jadi bila SP berubah 10x, maka dB bertambah ? x
 P= Tekanan = 0,0002 dynes/cm2. SP (microbar) SPL (dB) Ratio Intensitas. 0, , Jadi bila SP berubah 10x, maka dB bertambah x.")
15
Frekuensi Adalah jumlah getaran dalam tekanan suara per satuan waktu (Hertz atau cycle per detik), frekuensi dipengaruhi ukuran, bentuk dan pergerakan sumber, pendengaran normal orang dewasa dapat menangkap bunyi dengan frekuensi Hz.
, frekuensi dipengaruhi ukuran, bentuk dan pergerakan sumber, pendengaran normal orang dewasa dapat menangkap bunyi dengan frekuensi Hz.")
16
Frekuensi Dibagi dalam 8 octaf (octave bands), 37.5, 75, 150, 300, 600, 1200, 2400, 4800, 9600 Hz Telinga manusia bereaksi beda terhadap berbagai frekuensi Kebisingan ‘rata-rata’ mencakup seluruh taraf kebisingan dari setiap frekuensi dihitung Leq Leq = ekuivalen noise level/ekuivalen energi level Leq = 10 log10 (Σ 10 Lpi/10)
")
17
Satuan (Konversi) 1bar=105Pa=105N/m2 =105.105dyne/104cm2
=106dyne/cm2 atau 1microbar = 1 dyne/cm2

18
Sumber > 1….. dB=L=20 log(P1/P2)=10 log(P1/P2)2 L/10= log(P1/P2)2
10L/10= 10log(P1/P2)^2=(P1/P2)2 L=10 log(P1/P2)2 =10 log 10L/10 (satu sumber) L =10 log (Σ10Li/10) (sumber banyak) =10 log (10L1/10+ 10L2/10+…)
^2=(P1/P2)2. L=10 log(P1/P2)2. =10 log 10L/10 (satu sumber) L =10 log (Σ10Li/10) (sumber banyak) =10 log (10L1/10+ 10L2/10+…)")
19
Sumber > 1….. (Contoh) =10 log (Σ10Li/10) (banyak sumber)
Perbedaan antara sumber bunyi ΣdBA yang turun ditambah ke bunyi terbesar 3,0 1 2,6 2 2,1 3 1,8 4 1,5 5 1,2 6 1,0 7 0,8 8 0,6 10 0,4 12 0,3 14 0,2 16 0,1 =10 log (Σ10Li/10) (banyak sumber) =10 log (10L1/10+ 10L2/10+…)
 (banyak sumber) =10 log (10L1/10+ 10L2/10+…)")
20
Satuan (Konversi) 1bar=105Pa=105N/m2 =105.105dyne/104cm2
=106dyne/cm2 atau 1microbar = 1 dyne/cm2

21
Sumber > 1….. dB=L=20 log(P1/P2)=10 log(P1/P2)2 L/10= log(P1/P2)2
10L/10= 10log(P1/P2)^2=(P1/P2)2 L=10 log(P1/P2)2 =10 log 10L/10 (satu sumber) L =10 log (Σ10Li/10) (sumber banyak) =10 log (10L1/10+ 10L2/10+…)
^2=(P1/P2)2. L=10 log(P1/P2)2. =10 log 10L/10 (satu sumber) L =10 log (Σ10Li/10) (sumber banyak) =10 log (10L1/10+ 10L2/10+…)")
22
Sumber > 1….. (Contoh) =10 log (Σ10Li/10) (banyak sumber)
Perbedaan antara sumber bunyi ΣdBA yang turun ditambah ke bunyi terbesar 3,0 1 2,6 2 2,1 3 1,8 4 1,5 5 1,2 6 1,0 7 0,8 8 0,6 10 0,4 12 0,3 14 0,2 16 0,1 =10 log (Σ10Li/10) (banyak sumber) =10 log (10L1/10+ 10L2/10+…)
 (banyak sumber) =10 log (10L1/10+ 10L2/10+…)")
23
Tambah pada yg lebih tinggi
Kebisingan dari 2 sumber 14 Perbedaan antara 2 tingkat bising, dB(A) 3 2,5 12 10 8 6 4 2 0,5 1,5 1 Decibel yang ditambahkan pada tingkat kebisingan lebih tinggi Perbedaan (dB) Tambah pada yg lebih tinggi 0 atau 1 3 2 atau 3 2 4 – 9 1 10+
 3. 2, ,5. 1,5. 1. Decibel yang ditambahkan pada tingkat kebisingan lebih tinggi. Perbedaan (dB) Tambah pada yg lebih tinggi. 0 atau atau –")
24
Why unwanted? Health Effect, age, psychological: annoyed, concentration, rest/relax problem, communication annoyance, physiological: blood, heart, hearing loss, nausea, muscle control, acoustic trauma (permanent) vs temporary,
 vs temporary,")
25
Efek bising pada manusia
Psikologis, terkejut, mengganggu dan memutuskan konsentrasi, tidur dan saat istirahat Fisiologis, seperti menaikkan tekanan darah dan detak jantung, mengurangi ketajaman pendengaran, sakit telinga, mual, kendali otot terganggu, dll. Gangguan komunikasi yang mempengaruhi kenyamanan kerja dan keselamatan.

26
Interference with communication by speech
When background or ambient noise levels are sufficiently high enough, the background noise can mask the sound levels of speech that wish to be heard. Restaurants can often be classic examples of excessive noise interference due to lack of sufficient quality or quantity of sound absorbing materials that prevent excessive noise buildup. Diners have to speak louder and louder to be heard and in doing so compete with one another, thereby increasing the sound levels to even greater levels. Appropriate acoustical treatment will prevent the reflected noise buildup and significantly reduce the necessity for diners to speak louder to enjoy conversations with one another.

27
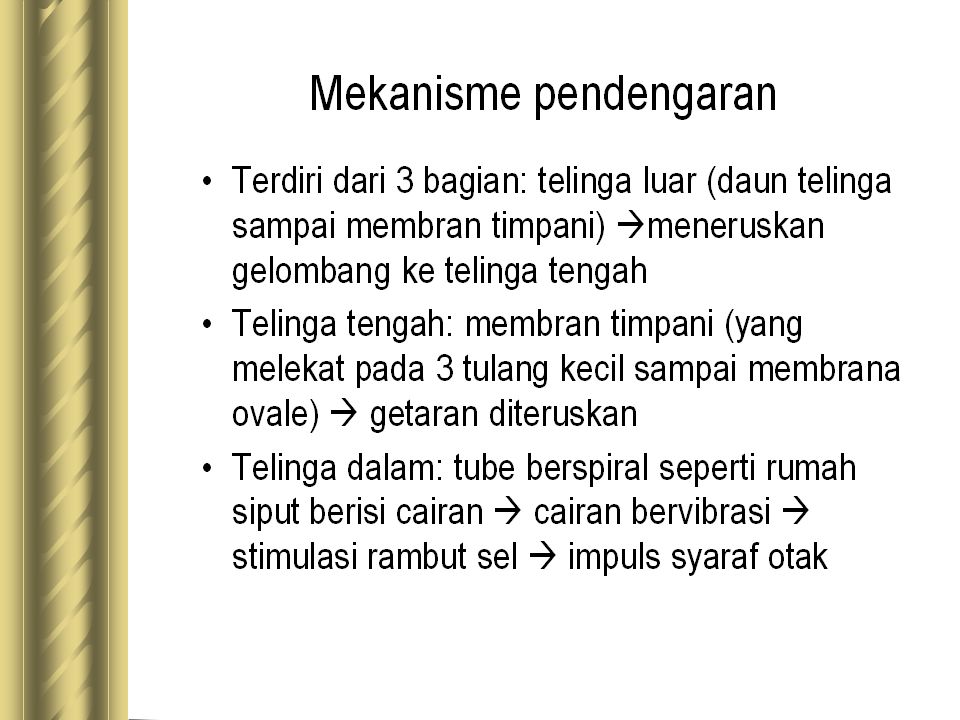
Mechanics of hearing

29
Gangguan pendengaran Pemaparan pada suara tinggi dan periode/durasi yang lama akan menyebabkan sel syaraf pendengar dan rambut pada corti over aktif sehingga menimbulkan kehilangan pendengaran permanen

31
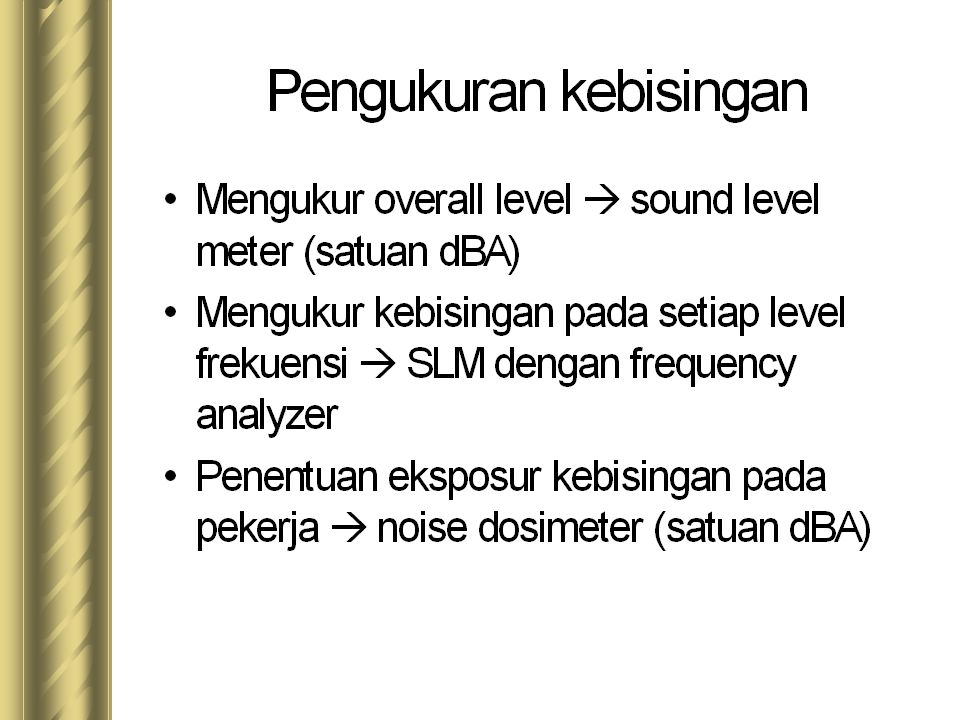
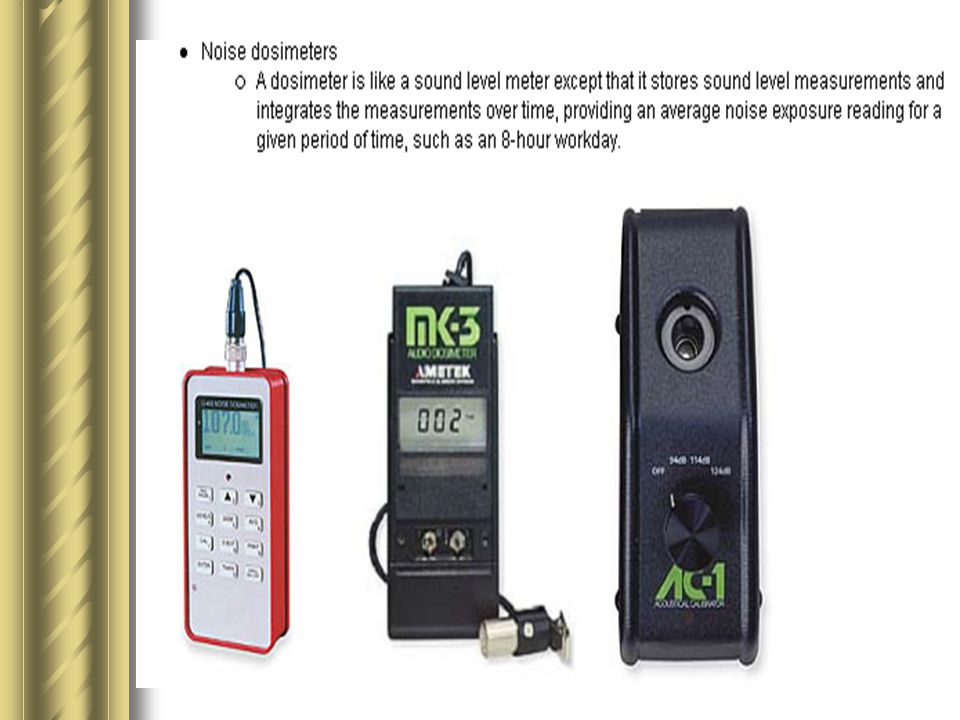
Alat ukur Sound level meter, mencatat keseluruhan suara yang dihasilkan tanpa memperhatikan frekuensi yang berhubungan dengan bising total ( d) – ( Hz) Sound level meter dengan octave band analyzer, mengukur level bising pada berbagai batas oktaf di atas range pendengaran manusia dengan mempergunakan filter menurut oktaf yang diinginkan (narrow band analyzers untuk spektrum sempit Hz)
 – ( Hz) Sound level meter dengan octave band analyzer, mengukur level bising pada berbagai batas oktaf di atas range pendengaran manusia dengan mempergunakan filter menurut oktaf yang diinginkan (narrow band analyzers untuk spektrum sempit Hz)")
32
NOISE MEASUREMENT KIT NOISE KALIBRATOR SOUND LEVEL METER NOISE DOSIMETER

33
PENGUKURAN PADA PEKERJA
DOSEBADGER

35
Construction Noise Levels
Pneumatic chip hammer Crane 90-96 Jackhammer Hammer 87-95 Concrete joint cutter 99-102 Gradeall 87-94 Skilsaw 88-102 Front-end loader 86-94 Stud welder 101 Backhoe 84-93 Bulldozer 93-96 Garbage disposal (at 3 ft.) 80 Earth Tamper Vacuum cleaner 70
 80. Earth Tamper. Vacuum cleaner. 70.")
36
Construction Noise Levels

37
Pengukuran akibat bising
Untuk mengevaluasi akibat pemaparan terhadap kehilangan pendengaran, kenyamanan, interferensi komunikasi dan mengumpulkan informasi untuk pengontrolan.

38
How Does Excessive Noise Damage Your Ears?
Microscopic hair cells of the cochlea are exposed to intense noise over time Hair cells become fatigued and less responsive, losing their ability to recover. Damage becomes permanent resulting in noise-induced permanent threshold shift. Risk of Hearing Loss Estimated Risk of Incurring Material Hearing Impairment as a Function of Average Daily Noise Exposure Over a 40-year Working Lifetime (source: NIOSH) Average Exposure 90 dBA 29% Average Exposure 85 dBA 15% Average Exposure 80 dBA 3%
 Average Exposure 90 dBA 29% Average Exposure 85 dBA 15% Average Exposure 80 dBA 3%")
40
Audiometric test

41
Audiometric test

42
Audiometric test Current OSHA Standards
Occupational Noise Exposure TABLE D-2 - PERMISSIBLE NOISE EXPOSURES Duration per day, hours Sound Level dBA slow response 8 90 6 92 4 95 3 97 2 100 1 1/2 102 1 105 1/2 110 1/4 or less 115

43
What Is The Purpose of Having a Hearing Test on a Regular Basis?
An audiometric testing program is used to track your ability to hear over time. Baseline and annual Test records provide the only data that can be used to determine whether the program is preventing noise-induced permanent threshold shifts. It is an integral part of the hearing conservation program. Case Study 1. Teenage Girl From the American Academy of Family Physicians website, Rabinowitz article

44
FIGURE 1. Audiogram findings in the patient in case 1.
The area below the curves represents sound levels that the patient could still hear. (X = left ear; O = right ear)
")
45
Case Study 1 Conclusion "Temporary threshold shift" example
Common in persons exposed to high noise Represents transient hair cell dysfunction Complete recovery can occur Repeated episodes of such shifts causes permanent threshold shifts because hair cells in the cochlea are progressively lost.

46
Case Study 2 Factory Worker Age 55

47
Case Study 2 Conclusion Noise Induced Hearing Loss Tinnitus
Speech discrimination and social function interference Difficulty in perceiving and differentiating consonant sounds Sounds such as a baby crying or a distant telephone ringing, may not be heard at all. Tinnitus Common symptom of noise overexposure Further interferes with hearing acuity, sleep and concentration. These impairments have been associated with depression and an increased risk of accidents.

48
Carpenter Hearing Losses by Age

49
Damage risk criteria Variation in individual susceptibility
The total energy of the sound The frequency distribution of the sound Other characteristics of the noise exposure, such as whether it is continuous, intermittent, or made up of a series of impacts The total daily time of exposure The length of employment in the noise environment.

50
Noise control A source radiating sound energy
A path along which the sound energy travels A receiver such as the human ear

53
Noise control Source: modification or redesigning of the source.
The modification of compressed air jets for parts ejection, to reduce noise by altering the jet flow. Multiple-opening air ejection nozzel: less noise than single-opening.

54
Noise control Noise can be controlled at the source, along the path or at the worker. At the source, equipment may be replaced by quieter models, or less noisy work procedures can be adopted. - In general, less friction and vibration mean less noise. Maintenance procedures such as lubrication may sometimes reduce noise by reducing friction. - Equipment can sometimes be modified to reduce the amount of noise that is generated. Sound-absorbing material may be attached to the noise source. Or the frequency of the noise may be shifted to one that is less hazardous.

55
Noise control Noise can often be controlled along the path to the worker with: - the use of sound-absorbing paneling on walls or ceilings, and - enclosures around noisy machinery. Controls at the worker include both administrative controls and personal protective equipment. Administrative controls modify how the work is carried out. The time employees spend in noisy areas may be reduced. Workers in noisy areas may be rotated to less noisy areas.

56
As the distance from the noise source increases, the pressure (or intensity) of the noise decreases faster than its sound level.
 of the noise decreases faster than its sound level.")
57
Noise control Noisy operations may be conducted outside normal working hours to reduce the number of people exposed. Where noise exposures cannot be reduced by other methods, hearing protection is required. This includes ear plugs and ear muffs.

58
Insulation of the workers
A separate noise insulated room provides effective control (up to 30 dB noise reduction).
.")
59
Machine insulation Machine: on floors and walls vibrate themsound radiation proper use of machine mountings insulates the machine and reduce the transmission of vibration

60
Control of noise by absorption
Travels out in all direction When encounter wallsreflected Total noise exposure within the room = direct + reflected noise Application of sound absorption material (However, limited: no effect on direct noise).
.")
61
Reduction of exposure time
Limiting the total daily exposure reduces the noise hazard. See TLV

62
Personal protection against noise
Many operations cannot be quieted by engineering methods. Therefore protection: ear plugs Properly worn: 25 – 400 dB protection Degree of discomfort employee education is adequate

63
Example…. Durasi tingkat bising yang diijinkan dapat dilihat dari tabel di bawah ini: Kebisingan yang terukur di suatu area adalah 90 dB selama 2 jam sehari, 97 dB selama 2 jam, dan sisa 4 jam berikutnya terdapat variasi tingkat bising secara bergantian 95 dB selama 10 menit dan 80 dB selama 10 menit. Tentukan apakah tingkat kebisingan yang terukur masih dalam batas yang diijinkan atau tidak. Durasi per hari Tingkat bising 8 6 4 3 2 1,5 1 90 92 95 97 100 102 105 107 110 115

64
Faktor-faktor yang mempengaruhi bising
Tipe bising: menerus dan terputus Lokasi pekerja Waktu kerja

65
NAB Kebisingan di lingkungan kerja
INDONESIA Permen 51/1999 USA (TLV ACGHI)
")
66
Waktu pemaparan vs dB (TLV)
Waktu pemaparan (jam) dB 8 6 4 2 1,5 1 0,5 <0,25 90 92 95 100 102 105 110 115 (Sumber: FHI)
 dB , ,5. <0, (Sumber: FHI)")
67
Steps aiming to control noise at work
Assess risks to develop a noise control plan Reduce risks for all employees Investigate and implement good practice for control of noise Prioritise noise control measures Use hearing protection for residual risks Carry out a noise dosimetry program to check the effectiveness of noise control measures

68
Some simple noise control techniques
Application of damping material to chutes, hoppers, machine guards etc., can give a 5-25 dB reduction in the noise radiated Cabin internal noise can be reduced by dB by applying damping pads and sound barrier mats to floor and engine bulkhead Reduce fan speed by 30% to achieve a noise reduction of 8 dB

69
BARRIER-BARIER ATAU PANEL

70
ISOLASI PEKERJA/MESIN DI TEMPAT BISING
BAHAN BARRIER BAHAN ABSORBER

71
Noise control can be complex
Engage employees in process Use noise control consultants to help solve your problems if complex

72
Hearing protectors Selected for protection, user preference and work activity Guard against over-protection — isolation can lead to under-use and safety risks Require information, instruction, training, supervision and motivation Will only protect if worn all the time and properly

73
Rating hearing protectors
The sound level conversion (SLC80 ) rating of a hearing protector, ear plugs or headset is a simple number and class rating that is derived from a test procedure as outlined in the Australian/New Zealand Standard AS/NZS 1270:2002
 rating of a hearing protector, ear plugs or headset is a simple number and class rating that is derived from a test procedure as outlined in the Australian/New Zealand Standard AS/NZS 1270:2002.")
74
Class and specification of hearing protectors
SLC80 Class May be used up to this noise exposure level 10 to 13 1 90 dB(A) 14 to 17 2 95 dB(A) 18 to 21 3 100 dB(A) 22 to 25 4 105 dB(A) 26 or greater 5 110 dB(A)
 14 to dB(A) 18 to dB(A) 22 to dB(A) 26 or greater dB(A)")
75
Ear plugs Properly fitted Wrongly fitted
Ensure people are properly trained in the correct fitting of ear plugs People’s ears are different. Is there sufficient variety of ear plugs provided to suit different ear canals and different job requirements? One size (and type) may not fit all, and comfort and effectiveness are important considerations to ensure compliance.
 may not fit all, and comfort and effectiveness are important considerations to ensure compliance.")
76
Ear muffs Proper clamping force Worn-out head band
Ear muffs left in the “up position” on hard hats may also lose their clamping force and the pads become compressed

77
Effective attenuation
Reduction in protection provided by hearing protectors with decreased wearing time Wear time Effective attenuation 60 minutes 30 dB 55 minutes 11 dB 50 minutes 8 dB 45 minutes 6 dB Example: Effectiveness of wearing an ear muff with a rating of 30 dB for an exposure time of one hour Sound attenuation = The reduction in the intensity or in the sound pressure level of sound which is transmitted from one point to another Effective attenuation = how well do the protectors do their job? If worn correctly for the full one hour then the attenuation (or decrease in sound energy) is 30 dB, as per the rating. But if taken off for a total of 5 minutes in that hour (e.g. to listen to someone speaking, rub ear), the effective attenuation is actually 11 dB and not 30 dB (remembering that the scale is logarithmic and 20 dB is 100 times the sound energy)!
 is 30 dB, as per the rating. But if taken off for a total of 5 minutes in that hour (e.g. to listen to someone speaking, rub ear), the effective attenuation is actually 11 dB and not 30 dB (remembering that the scale is logarithmic and 20 dB is 100 times the sound energy)!")
78
Our challenge Away from … Noise assessment as the end point
Reliance on hearing protection Towards … Control of noise risks through prioritised action plans Introducing equipment with good noise and vibration characteristics – ‘Buy Quiet’

79
TWA untuk kebisingan: berdasarkan standar kebisingan.
Jumlah jam dB(A) 8 90 6 92 4 95 3 97 2 100 Jumlah jam dB(A) 1,5 102 1,0 105 0,75 107 0,5 110 0,25 115 dB(A) 80 90 95 97 100 1 T ukur 2 jam 4 jam T TLV tt 8 jam 3 jam TWA 4/8 2/4 = 1 < batas aman 2 2 jam 2/8 2/3 = 17/12 >batas aman
 Jumlah jam. dB(A) 1, , , , , dB(A) T ukur. 2 jam. 4 jam. T TLV. tt. 8 jam. 3 jam. TWA. 4/8. 2/4. = 1 < batas aman jam. 2/8. 2/3. = 17/12 >batas aman.")
80
Noise 3. 4 orang pekerja printer di unit percetakan dimana terdapat
offset press. Masing-masing terpapar sbb: Berapa dosis harian yang diterimanya? dan Equivalent 8-hour Sound Pressure Level (SPL) yang dialami pekerja percetakan tersebut? No. of presses operating Average Sound Pressure Level (dBA) Average daily time in operation (hours) 81 4.5 1 93 2.1 2 96 1.0 3 98 0.4
 yang dialami pekerja percetakan tersebut No. of presses operating. Average Sound Pressure Level (dBA) Average daily time in operation (hours)")
81
Jawab: = 27.858 jam = 5.278 jam = 3.482 jam = 2.639 jam
Untuk SPL 81 dBA: = jam Untuk SPL 93 dBA: = jam Untuk SPL 96 dBA: = jam Untuk SPL 98 dBA: = jam

82
Noise = 0.998 Now, expressing this result as a percentage as required by the problem statement, we have: Dprinter= 99.8% The Printing Company that employs these four Printers is not in violation of any established OSHA SPL dosage standards.

83
Noise Lequivalent = 90 + 16.61 log[0.998] = 89.987 ~ 90 dBA
These Printers experience an equivalent SPL of ~ 90 dBA
![Noise Lequivalent = log[0.998] = ~ 90 dBA](http://slideplayer.info/slide/2993017/11/images/83/Noise+Lequivalent+%3D+log%5B0.998%5D+%3D+%7E+90+dBA.jpg "These Printers experience an equivalent SPL of ~ 90 dBA.")
84
Noise 4. How much longer is an individual, without hearing protection, permitted to work at a location where the noise level has just been reduced from 104 dBA to 92 dBA?

85
To answer this question, we must first determine the OSHA permitted duration, in hours, for each of the two identified noise levels. Tmax = 8 / [2(L-90)/5] For an SPL of 104 dBA: 104 dBA= 8 / [2(104-90)/5] = hours For an SPL of 92 dBA: 92 dBA= 8 / [2(92-90)/5] = hours The additional time permitted at the lesser noise level of 92 dBA, ΔTmax, is simply the difference between these two OSHA permitted time intervals; thus: ΔTmax=6.063 – = hours This individual can spend an additional 4.9 hours at a 92 dBA noise level
/5] For an SPL of 104 dBA: 104 dBA= 8 / [2(104-90)/5] = hours. For an SPL of 92 dBA: 92 dBA= 8 / [2(92-90)/5] = hours. The additional time permitted at the lesser noise level of 92 dBA, ΔTmax, is simply the difference between these two OSHA permitted time intervals; thus: ΔTmax=6.063 – = hours. This individual can spend an additional 4.9 hours at a 92 dBA noise level.")
Presentasi serupa


>")


