Upload presentasi
Presentasi sedang didownload. Silahkan tunggu

1
Systems Analysis and Design 3. System Analysis
Systems Analysis and Design 3. System Analysis Romi Satria Wahono WA/SMS:

2
Romi Satria Wahono SD Sompok Semarang (1987) SMPN 8 Semarang (1990)
SMA Taruna Nusantara Magelang (1993) B.Eng, M.Eng and Ph.D in Software Engineering from Saitama University Japan ( ) Universiti Teknikal Malaysia Melaka (2014) Research Interests: Software Engineering, Intelligent Systems Founder dan Koordinator IlmuKomputer.Com Peneliti LIPI ( ) Founder dan CEO PT Brainmatics Cipta Informatika
 B.Eng, M.Eng and Ph.D in Software Engineering from Saitama University Japan ( ) Universiti Teknikal Malaysia Melaka (2014) Research Interests: Software Engineering, Intelligent Systems. Founder dan Koordinator IlmuKomputer.Com. Peneliti LIPI ( ) Founder dan CEO PT Brainmatics Cipta Informatika.")
3
Contents Introduction Project Planning System Analysis System Design
System Implementation

4
Recap Identifying the business value of the new project is a key to success The system request describes an overview of the proposed system. The feasibility study is concerned with insuring that technical, economic, and organizational benefits outweigh costs and risks Project estimation methods: simply method, function point and use case point

5
3. System Analysis

6
Learning Objectives Understand how to create a requirements definition
Become familiar with requirements analysis techniques Understand when to use each requirements analysis technique Understand how to gather requirements using interviews, JAD sessions, questionnaires, document analysis, and observation Understand when to use each requirements- gathering technique Understand the system analysis and design using UML

7
SDLC and Deliverables Planning Analysis (System Specification)
Object-Oriented Programming SDLC and Deliverables Planning (System Proposal) Analysis (System Specification) Design (System Specification) Implementation (New System)
 Analysis (System Specification) Design (System Specification) Implementation (New System)")
8
Requirement Gathering

9
What is a Requirement Business Requirement
Statement of what the system must do Focus on what the system must do, not how to do it There are 2 kinds of requirements Functional Nonfunctional

10
Functional Requirement
Defines the functions of the system must carry out Specifies the process that must be performed Examples: Diagrams: Activity Diagrams Use Case Diagrams Problem Statements: Must search for inventory Must perform these calculations Must produce a specific report

11
Nonfunctional Requirements
Deals with how the system behaves: Operational – Physical/technical environment Performance – Speed and reliability Security – Who can use the system Cultural & Political – Company policies, legal issues

13
Requirement Gathering Methods
Document Analysis Interviews Joint Application Design (JAD) Questionnaires Observation
 Questionnaires. Observation.")
14
1. Document Analysis Provides clues about the "formal" existing As- Is system Typical documents Forms Reports Policy manuals Look for user additions to forms Look for unused form elements Do document analysis before interviews

15
2. Interviews Most commonly used technique Very natural
If you need to know something, you ask someone Five basic steps: Selecting interviewees Designing interview questions Preparing for the interview Conducting the interview Post-interview follow-up

16
3. Joint Application Design (JAD)
Allows project managers, users, and developers to work together May reduce scope creep by 50% Avoids requirements being too specific or too vague Include 10 to 20 users Tend to last 5 to 10 days over a three week period

17
JAD Meeting Room JPEG Figure 5-5 Goes Here

18
4. Questionnaire Selecting participants Designing the questionnaire
Using samples of the population Designing the questionnaire More important than interview questions Prioritize questions to grab attention Distinguish between Fact-oriented questions (specific answers) Opinion questions (agree – disagree scale) Test the questionnaire on colleagues
 Opinion questions (agree – disagree scale) Test the questionnaire on colleagues.")
19
4. Questionnaire Questionnaire follow-up
Administering the questionnaire Need to get good response rate Explain its importance & how it will be used Give expected response date Follow up on late returns Have supervisors follow up Promise to report results Questionnaire follow-up Send results to participants

20
5. Observation Users/managers often don’t remember everything they do
Validates info gathered in other ways Behaviors change when people are watched Keep low profile, don’t change the process Careful not to ignore periodic activities Weekly … Monthly … Annual

21
Selecting the Appropriate Techniques
Interviews JAD Questionnaires Document Observation Analysis Type of As-Is As-Is As-Is As-Is As-Is Information Improve Improve. Improve. To-Be To-Be Depth of High High Medium Low Low Information Breadth of Low Medium High High Low Integration Low High Low Low Low of Info. User Medium High Low Low Low Involvement Cost Medium Low Low Low Low- Medium Medium

22
Business Process Analysis

23
Business Process Analysis Steps

24
Business Process Analysis Strategies
BPA (Business Process Automation) BPI (Business Process Improvement) BPR (Business Process Reengineering)
 BPI (Business Process Improvement) BPR (Business Process Reengineering)")
25
Business Process Automation
Makes almost no changes to business processes Just makes them more efficient Improves efficiency by automating the business processes Least impact on users They do the same things, just more efficiently

26
Business Process Improvement
Goal is to improve the business processes Change what the users do, not just how efficiently they do it Changes to business process must be decided first Decisions to change the business processes cannot be made by the analyst

27
Business Process Reengineering
“Fundamental rethinking and radical redesign of business processes to achieve dramatic improvements…” Throw away everything Start with a blank page Appealing, but very expensive and risky

28
Automation Improvement Reeingineering
Strategy Comparation Business Business Business Process Process Process Automation Improvement Reeingineering Potential Business Low-Moderate Moderate High Value Project Cost Low Low-Moderate High Breadth of Analysis Narrow Narrow-Moderate Very Broad Risk Low Low-Moderate Very High

29
Barriers to Requirements Gathering

30
Barriers to Requirements Elicitation
Object-Oriented Programming Barriers to Requirements Elicitation The "Yes, But" Syndrome The "Undiscovered Ruins" Syndrome The "User and the Developer" Syndrome

31
The "Yes, But" Syndrome For whatever reason, we always see two immediate, distinct, and separate reactions when the users see the system implementation for the first time. "Wow, this is so cool; we can really use this, what a neat job" and so on. "Yes, but, hmmmmm, now that I see it, what about this ... ? Wouldn't it be nice if ? Whatever happened to ?“

32
The "Yes, But" Syndrome The "Yes, But" syndrome is human nature and is an integral part of application development. We should plan to avoid or significantly reduce this syndrome by applying techniques that get the "Buts" out early. In so doing, we elicit the "Yes, But" response early, and we then can begin to invest the majority of our development efforts in software that has already passed the "Yes, But" test.

33
The "Undiscovered Ruins" Syndrome
In many ways, the search for requirements is like a search for undiscovered ruins. The more you find, the more you know remain. You never really feel that you have found them all, and perhaps you never will. Indeed, software development teams always struggle to determine when they are done with requirements elicitation. When have they found all the requirements or at least enough requirements?

34
The "User and the Developer" Syndrome
Communication gap between the user and the developer. Users and developers are typically from different worlds, may even speak different languages, and have different backgrounds, motivations, and objectives.

35
The "User and the Developer" Syndrome
Reasons for this problem and some suggested solutions

36
Key Points Requirements elicitation is complicated by three endemic syndromes. The "Yes, But" syndrome stems from human nature and the users' inability to experience the software as they might a physical device. Searching for requirements is like searching for "Undiscovered Ruins"; the more you find, the more you know remain. The "User and the Developer" syndrome reflects the profound differences between these two, making communication difficult.

37
Analysis and Design using UML

38
Analysis Design Paradigm and Diagrams
Data-oriented DFD Process-oriented Flowchart Object-oriented (data + process) UML
 UML.")
39
Booch, Jacobson, Rumbaugh
Sejarah UML Booch, Jacobson, Rumbaugh In the 90s many people creating OO diagramming languages Three different ones created by Grady Booch, Ivar Jacobson, James Rumbaugh Joined forces with Rational (company) to create Unified Modeling Langauge (UML)
 to. create Unified Modeling. Langauge (UML)")
40
Sejarah UML UML 2.4

41
What is the UML? UML: Unified Modeling Language
UML can be used for modeling all processes in the development life cycle and across different implementation technologies (technology and language independent) UML is the standard language for visualizing, specifying, constructing, and documenting the artifacts of a software-intensive system UML is a communication tool – for the team, and other stakeholders
 UML is the standard language for visualizing, specifying, constructing, and documenting the artifacts of a software-intensive system. UML is a communication tool – for the team, and other stakeholders.")
42
The Triangle of Success in Software Dev.
Notation: Standard Tools: Support Standard and Process Process: Customer-Oriented Methodology

43
UML Tools Rational Rose Visual Paradigm Enterprise Architect
Microsoft Visio Star UML Netbeans UML Plugin

44
UML 2.0 Diagrams UML version 2.0 has 14 diagrams in 2 major groups:
Object-Oriented Programming UML 2.0 Diagrams UML version 2.0 has 14 diagrams in 2 major groups: Structure Diagrams Behavior Diagrams

45
UML 2.0 Diagram

46
UML Structure Diagrams
Represent the data and static relationships in an information system Class Diagram Object Diagram Package Diagram Deployment Diagram Component Diagram Composite Structure Diagram

47
Structure Diagrams Class Diagrams Object Diagrams Package Diagrams
Common vocabulary used by analyst and users Represent things (employee, paycheck,…) Shows the relationships between classes Object Diagrams Similar to class diagrams Instantiation of a class diagram Relationships between objects Package Diagrams Group UML elements together to form higher level constructs
 Shows the relationships between classes. Object Diagrams. Similar to class diagrams. Instantiation of a class diagram. Relationships between objects. Package Diagrams. Group UML elements together to form higher level constructs.")
48
Structure Diagrams Deployment Diagrams Component Diagrams
Shows the physical architecture and software components of system For example, network nodes Component Diagrams Physical relationships among software components Example – Client/Server (Which machines run which software) Composite Structure Illustrates internal structure of a complex class
 Composite Structure. Illustrates internal structure of a complex class.")
49
UML Behavior Diagrams Depict the dynamic relationships among the instances or objects that represent the business information system Activity Diagram Timing Diagram Sequence Diagram Behavior State Machine Communication Diagram Protocol State Machine Interaction Diagram Use Case Diagrams

50
Behavior Diagrams Activity Diagrams Interaction Diagrams
Model processes in an information system Example: Business workflows, business logic Interaction Diagrams Shows interaction among objects Sequence Diagrams Time-based ordering of the interaction Communication Diagrams Communication among a set of collaborating objects of an activity

51
Behavior Diagrams Interaction Diagrams Timing Diagrams State Machines
Overview of flow of control of a process Timing Diagrams Show how an object changes over time State Machines Examines behavior of one class Models the different states and state transitions an object can experience Use-Case Diagrams Shows interaction between the system and environment Captures business requirements

52
UML Problems UML is modeling notation, it is not a development process or a methodology UML driven development process? UML is too complex, difficult to understand quickly Should we use all UML diagrams?

53
Object-Oriented Programming UML Process (EA Sparx) Display the boundary of a system and its major functions using use cases and actors Model the organization’s business process with activity diagram Illustrate use case realizations with sequence diagrams Represent a static structure of a system using class diagrams Reveal the physical implementation architecture with deployment diagrams

54
UML Process (EA Sparx) Use Cases Diagram Activity Diagram
Object-Oriented Programming UML Process (EA Sparx) Use Cases Diagram Activity Diagram Sequence Diagram Class Diagram Deployment Diagrams
 Use Cases Diagram. Activity Diagram. Sequence Diagram. Class Diagram. Deployment Diagrams.")
55
UML Process (Kendal, 2011) A use case diagram, describing how the system is used. Analysts start with a use case diagram An activity diagram, illustrating the overall flow of activities. Each use case may create one activity diagram Sequence diagrams, showing the sequence of activities and class relationships. Each use case may create one or more sequence diagrams Class diagrams, showing the classes and relationships. Sequence diagrams are used to determine classes Statechart diagrams, showing the state transitions. Each class may create a statechart diagram, which is useful for determining class methods

56
(Kendall and Kendall, 2011)
")
57
UML Process (Barclay, 2004)
")
58
System Analysis and Design with UML
Business Process Identification Use Case Diagram Business Process Modeling Activity Diagram or Business Process Modeling Notation (BPMN) Business Process Realization Sequence Diagram (Buat untuk setiap use case dengan menggunakan pola Boundary-Control-Entity) System Design Program Design Class Diagram (Gabungkan Boundary-Control-Entity Class dan susun story dari sistem yang dibangun) Package Diagram (Gabungan class yang sesuai, boleh menggunakan pola B-C-E) Deployment Diagram (arsitektur software dari sistem yang dibangun) User Interface Design (Buat UI design dari Boundary Class) Entity-Relationship Model (Buat ER diagram dari Entity Class)
 Business Process Realization. Sequence Diagram (Buat untuk setiap use case dengan menggunakan pola Boundary-Control-Entity) System Design. Program Design. Class Diagram (Gabungkan Boundary-Control-Entity Class dan susun story dari sistem yang dibangun) Package Diagram (Gabungan class yang sesuai, boleh menggunakan pola B-C-E) Deployment Diagram (arsitektur software dari sistem yang dibangun) User Interface Design (Buat UI design dari Boundary Class) Entity-Relationship Model (Buat ER diagram dari Entity Class)")
59
Case Study: ATM System

60
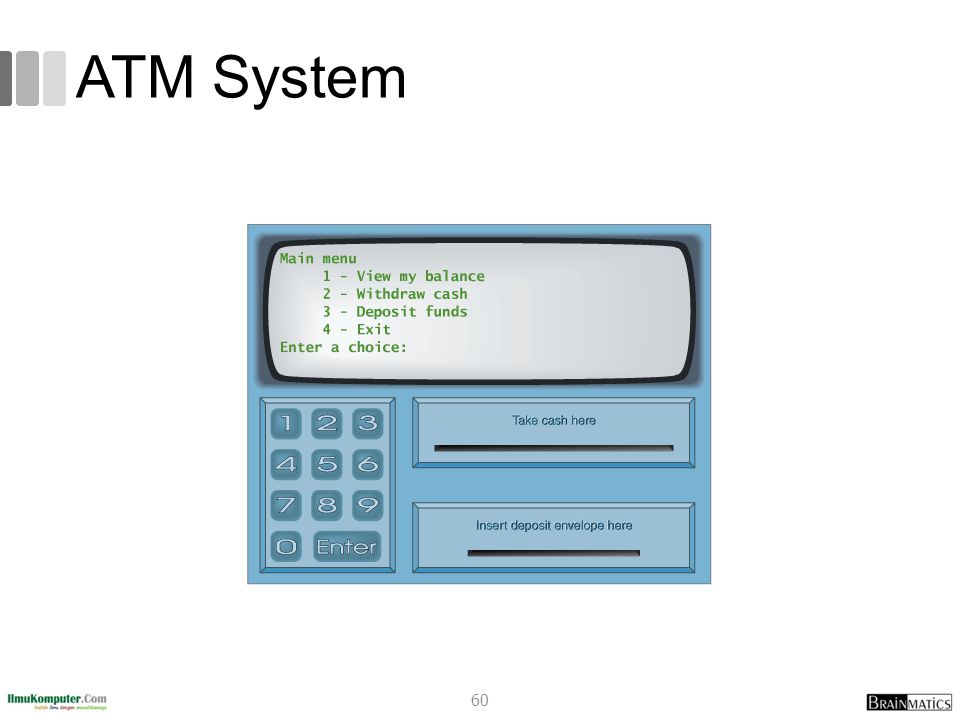
ATM System romi@romisatriawahono.net Object-Oriented Programming
61
ATM System Layar Kotak Uang Kotak Kartu Kotak Kuitansi
Object-Oriented Programming ATM System Layar Kotak Uang Kotak Kartu Kotak Kuitansi

62
Masukkan PIN: Kotak Uang Kotak Kartu Kotak Kuitansi
Object-Oriented Programming Masukkan PIN: Kotak Uang Kotak Kartu Kotak Kuitansi

63
Menu Utama Melihat Saldo Mentransfer Uang Mengambil Uang Logout
Object-Oriented Programming Menu Utama Melihat Saldo Mentransfer Uang Mengambil Uang Logout Kotak Uang Kotak Kartu Kotak Kuitansi

64
Saldo anda adalah …. Menu Melihat Saldo Kotak Uang Kotak Kartu
Object-Oriented Programming Menu Melihat Saldo Saldo anda adalah …. Kotak Uang Kotak Kartu Kotak Kuitansi

65
No Account Penerima: Menu Mentransfer Uang Kotak Uang Kotak Kartu
Object-Oriented Programming Menu Mentransfer Uang No Account Penerima: Kotak Uang Kotak Kartu Kotak Kuitansi

66
Jumlah uang yang dikirim:
Object-Oriented Programming Menu Mentransfer Uang Jumlah uang yang dikirim: Kotak Uang Kotak Kartu Kotak Kuitansi

67
Uang berhasil terkirim
Object-Oriented Programming Menu Mentransfer Uang Uang berhasil terkirim Kotak Uang Kotak Kartu Kotak Kuitansi

68
Jumlah uang yang diambil:
Object-Oriented Programming Menu Mengambil Uang Jumlah uang yang diambil: Kotak Uang Kotak Kartu Kotak Kuitansi

69
Uang berhasil diambil Menu Mengambil Uang Kotak Uang Kotak Kartu
Object-Oriented Programming Menu Mengambil Uang Uang berhasil diambil Kotak Uang Kotak Kartu Kotak Kuitansi

70
Use Case Diagram

71
Use Case Diagram (Alternatif)
")
72
Activity Diagram: Memasukkan Kartu

73
Activity Diagram: Memasukkan PIN

74
Activity Diagram: Mengecek Saldo

75
Activity Diagram: Mentransfer Uang

76
Activity Diagram: Mengambil Uang

77
Activity Diagram: Melakukan Logout

78
Sequence Diagram: Memasukkan Kartu

79
Type of Class Boundary Class Control Class Entity Class
Object-Oriented Programming Type of Class Boundary Class Class yang berhubungan dengan actor (user interface) Control Class Class yang berhubungan dengan pemrosesan, komputasi, penghitungan, dsb Entity Class Class yang berhubungan dengan data (flat file or database)
 Control Class. Class yang berhubungan dengan pemrosesan, komputasi, penghitungan, dsb. Entity Class. Class yang berhubungan dengan data (flat file or database)")
80
Sequence Diagram: Memasukkan PIN

81
Sequence Diagram: Mengecek Saldo

82
Sequence Diagram: Mentransfer Uang

83
Sequence Diagram: Mengambil Uang

84
Sequence Diagram: Melakukan Logout

85
Class Diagram

86
Deployment Diagram (3 Tier)
")
87
Data Model

88
User Interface Design

89
User Interface Design (Netbeans)
")
90
Business Process Identification

91
System Analysis and Design with UML
Business Process Identification Use Case Diagram Business Process Modeling Activity Diagram or Business Process Modeling Notation (BPMN) Business Process Realization Sequence Diagram (Buat untuk setiap use case dengan menggunakan pola Boundary-Control-Entity) System Design Program Design Class Diagram (Gabungkan Boundary-Control-Entity Class dan susun story dari sistem yang dibangun) Package Diagram (Gabungan class yang sesuai, boleh menggunakan pola B-C-E) Deployment Diagram (arsitektur software dari sistem yang dibangun) User Interface Design (Buat UI design dari Boundary Class) Entity-Relationship Model (Buat ER diagram dari Entity Class)
 Business Process Realization. Sequence Diagram (Buat untuk setiap use case dengan menggunakan pola Boundary-Control-Entity) System Design. Program Design. Class Diagram (Gabungkan Boundary-Control-Entity Class dan susun story dari sistem yang dibangun) Package Diagram (Gabungan class yang sesuai, boleh menggunakan pola B-C-E) Deployment Diagram (arsitektur software dari sistem yang dibangun) User Interface Design (Buat UI design dari Boundary Class) Entity-Relationship Model (Buat ER diagram dari Entity Class)")
92
Use Case Diagram

93
Use Case Diagrams Summarized into a single picture
All of the use cases for the part of the system being modeled Use case represents the discrete activities performed by the user Use Case Diagram tells what the system will do Good for communicating with users

94
Syntax for an Use Case Diagram
Actor person or system that derives benefit from and is external to the subject Use Case Represents a major piece of system functionality Association Relationship Include Relationship Extend Relationship Generalization Relationship <<includes>> <<extends>>

95
Use Case Use Case A major piece of system functionality
Can extend other Use Cases Placed inside system boundary Labeled with descriptive verb - noun phrase Use Case

96
System Boundary Boundary
Includes the name of the system inside or on top Represents the scope of the system Actors are outside the scope of the system Boundary

97
Actor A person or another system that interacts with the current system A role, not a specific user Provides input, receives output, or both actor Actor/Role

98
Association Relationship
Links actor and the Use Case Shows two-way communication If one-way, arrows are used * is for "multiplicity of the Association" * *

99
Extends Relationship extend
Extends Use Case to include Optional behavior Arrow points from the extension Use Case to the base Use Case extend extend Make Appointment Make Payment Arrangement

100
Include Relationship include
Include one Use Case from within another Arrow points from base Use Case to the included Use Case include include Make New Patient Appointment Create New Patient

101
Generalization Relationship
A specialized Use Case to a more generalized Use Case Arrow points from specialized to general Use Case Make Old Appointment Make Appointment

102
Use Case Diagram for Appointment System

103
Use Case Diagram with Specialized Actor

104
Extend and Include Relationships

105
Studi Kasus: ATM System

106
ATM System

107
ATM System Layar Kotak Uang Kotak Kartu Kotak Kuitansi
Object-Oriented Programming ATM System Layar Kotak Uang Kotak Kartu Kotak Kuitansi

108
Masukkan PIN: Kotak Uang Kotak Kartu Kotak Kuitansi
Object-Oriented Programming Masukkan PIN: Kotak Uang Kotak Kartu Kotak Kuitansi

109
Menu Utama Melihat Saldo Mentransfer Uang Mengambil Uang Logout
Object-Oriented Programming Menu Utama Melihat Saldo Mentransfer Uang Mengambil Uang Logout Kotak Uang Kotak Kartu Kotak Kuitansi

110
Saldo anda adalah …. Menu Melihat Saldo Kotak Uang Kotak Kartu
Object-Oriented Programming Menu Melihat Saldo Saldo anda adalah …. Kotak Uang Kotak Kartu Kotak Kuitansi

111
No Account Penerima: Menu Mentransfer Uang Kotak Uang Kotak Kartu
Object-Oriented Programming Menu Mentransfer Uang No Account Penerima: Kotak Uang Kotak Kartu Kotak Kuitansi

112
Jumlah uang yang dikirim:
Object-Oriented Programming Menu Mentransfer Uang Jumlah uang yang dikirim: Kotak Uang Kotak Kartu Kotak Kuitansi

113
Uang berhasil terkirim
Object-Oriented Programming Menu Mentransfer Uang Uang berhasil terkirim Kotak Uang Kotak Kartu Kotak Kuitansi

114
Jumlah uang yang diambil:
Object-Oriented Programming Menu Mengambil Uang Jumlah uang yang diambil: Kotak Uang Kotak Kartu Kotak Kuitansi

115
Uang berhasil diambil Menu Mengambil Uang Kotak Uang Kotak Kartu
Object-Oriented Programming Menu Mengambil Uang Uang berhasil diambil Kotak Uang Kotak Kartu Kotak Kuitansi

116
Use Case Diagram

117
Use Case Diagram (Alternatif)
")
118
Exercise: Business Process Identification
Lihat kembali System Request yang sudah anda buat Lakukan business process identification dengan membuatkan Use Case Diagram untuk System Request tersebut

119
Exercise: Systems Analysis and Design
Object-Oriented Programming Exercise: Systems Analysis and Design Lakukan sistem analysis and design yang menghasilkan diagram: Use Case Diagram Pilih salah satu aplikasi di bawah: Aplikasi Rental Mobil Aplikasi Pengelolaan Klinik Aplikasi Pengelolaan Apotik Aplikasi Pengelolaan Service Mobil Aplikasi Penjualan Motor Aplikasi Pengelolaan Perpustakaan Aplikasi Penjualan Buku Online Aplikasi Penjualan Tiket Kereta Online Aplikasi Manajemen Universitas Online Aplikasi Penjualan Laptop Online Aplikasi Perpustakaan Digital Aplikasi Pengelolaan Project Software

120
Business Process Modeling

121
System Analysis and Design with UML
Business Process Identification Use Case Diagram Business Process Modeling Activity Diagram or Business Process Modeling Notation (BPMN) Business Process Realization Sequence Diagram (Buat untuk setiap use case dengan menggunakan pola Boundary-Control-Entity) System Design Program Design Class Diagram (Gabungkan Boundary-Control-Entity Class dan susun story dari sistem yang dibangun) Package Diagram (Gabungan class yang sesuai, boleh menggunakan pola B-C-E) Deployment Diagram (arsitektur software dari sistem yang dibangun) User Interface Design (Buat UI design dari Boundary Class) Entity-Relationship Model (Buat ER diagram dari Entity Class)
 Business Process Realization. Sequence Diagram (Buat untuk setiap use case dengan menggunakan pola Boundary-Control-Entity) System Design. Program Design. Class Diagram (Gabungkan Boundary-Control-Entity Class dan susun story dari sistem yang dibangun) Package Diagram (Gabungan class yang sesuai, boleh menggunakan pola B-C-E) Deployment Diagram (arsitektur software dari sistem yang dibangun) User Interface Design (Buat UI design dari Boundary Class) Entity-Relationship Model (Buat ER diagram dari Entity Class)")
122
Business Process Modeling with Activity Diagrams

123
BPM With Activity Diagrams
A number of activities support a business process across several departments Activity diagrams model the behavior in a business process

124
Syntax for an Activity Diagram

125
Activity Diagram Example

126
Creating Activity Diagrams
Set the context or scope of the activity being modeled Identify the activities and control/object flows between activities Identify any decisions made Look for opportunities for parallelism Draw the diagram

127
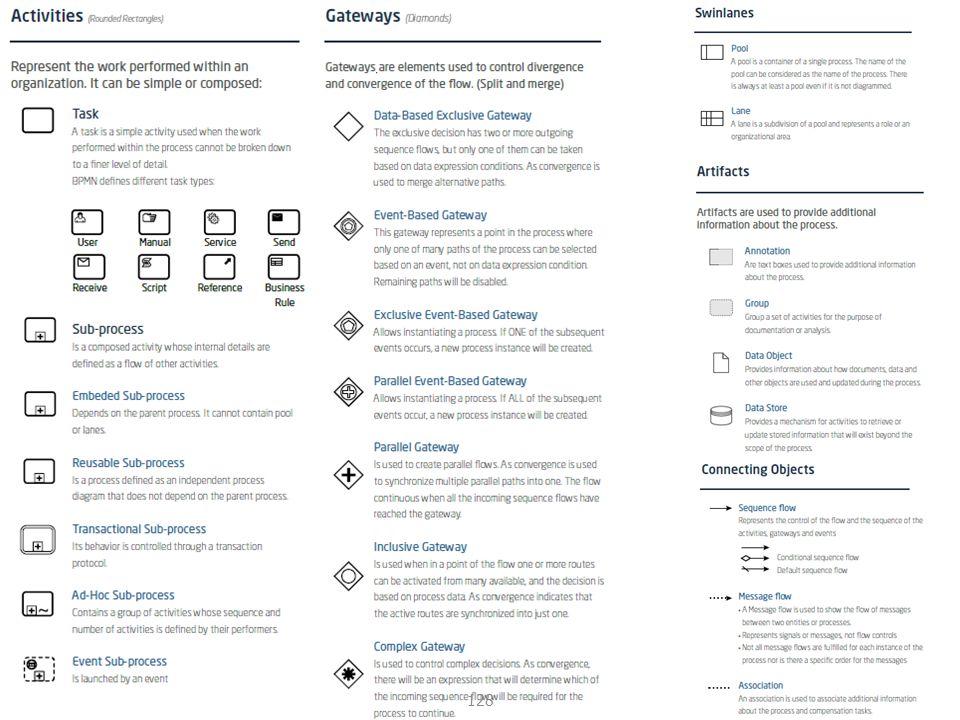
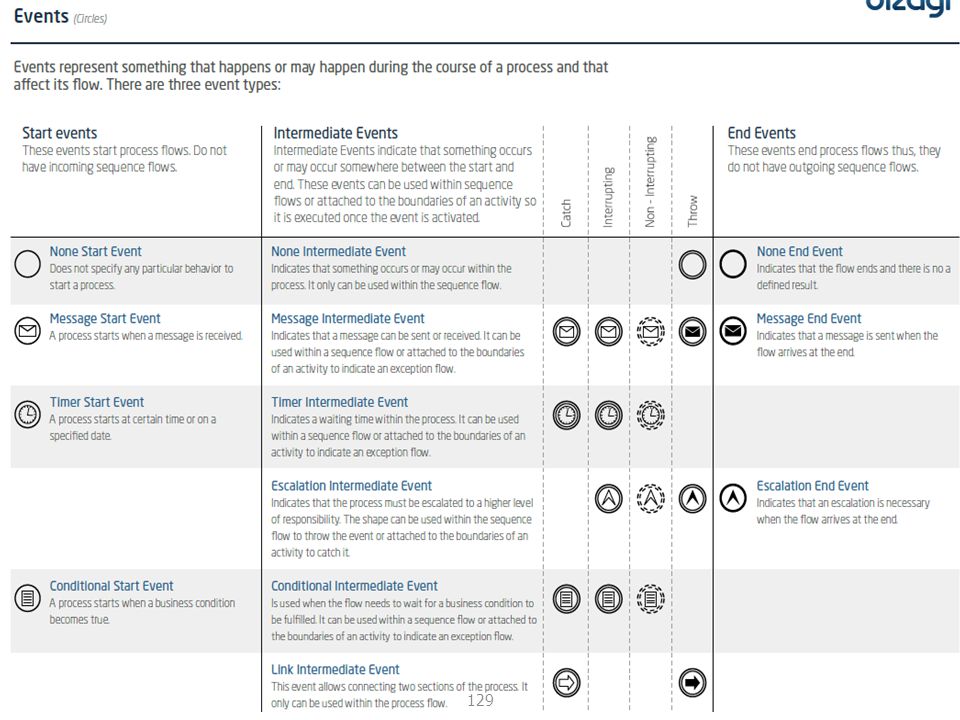
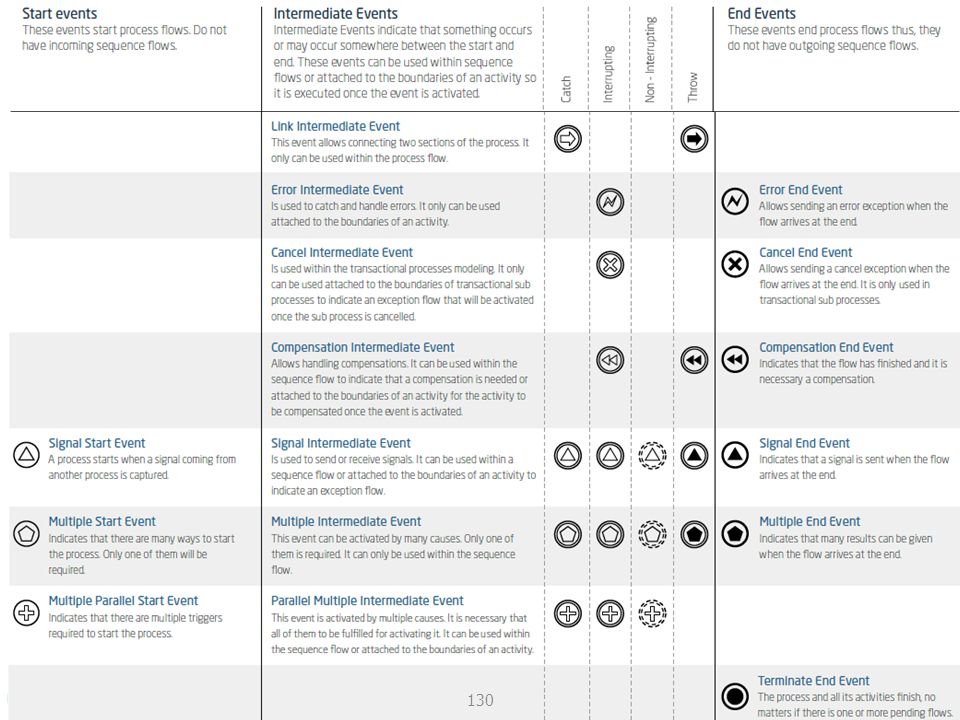
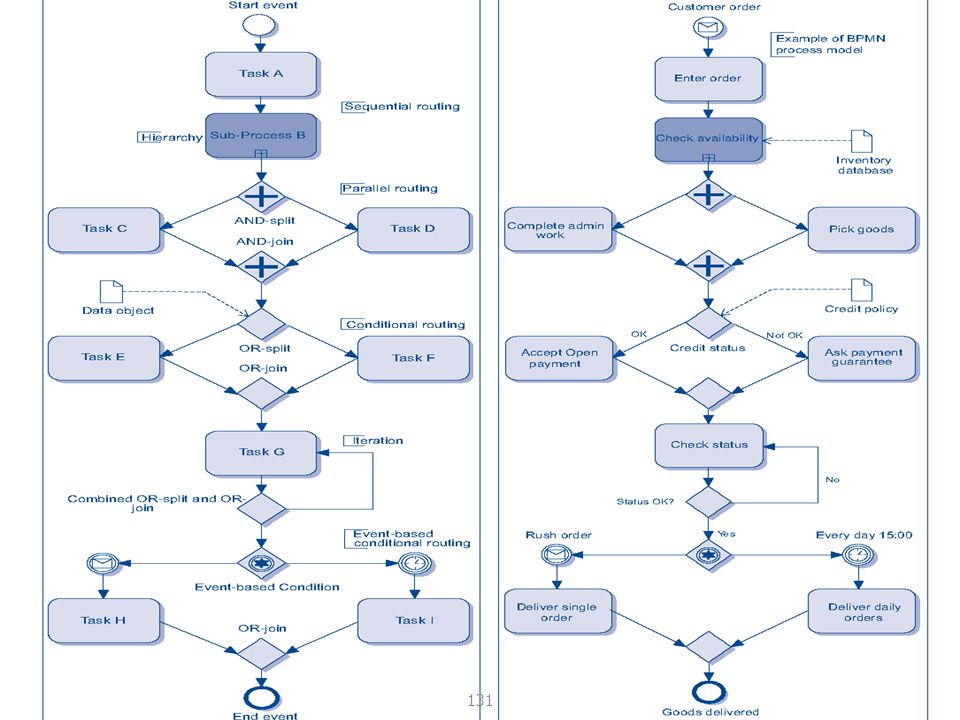
Business Process Modeling with BPMN

132
Credit Application

133
Purchase Request

134
Shipment Process of a Hardware Retailer

135
The Pizza Collaboration

136
Order Fulfillment and Procurement

137
Studi Kasus: ATM System

138
Activity Diagram: Memasukkan Kartu

139
Activity Diagram: Memasukkan PIN

140
Activity Diagram: Mengecek Saldo

141
Activity Diagram: Mentransfer Uang

142
Activity Diagram: Mengambil Uang

143
Activity Diagram: Melakukan Logout

144
Exercise: Business Process Modeling
Lihat kembali System Request dan Use Case Diagram yang sudah anda buat Lakukan business process modeling dengan membuatkan Activity Diagram untuk setiap Use Case yang dibuat Yang harus dibuat: System Request, Feasibility Analysis, Project Size Estimation (FP) (DOC dan XLS), Use Case Diagram, Activity Diagram (EAP)
 (DOC dan XLS), Use Case Diagram, Activity Diagram (EAP)")
145
Exercise: Systems Analysis and Design
Object-Oriented Programming Exercise: Systems Analysis and Design Lakukan sistem analysis and design yang menghasilkan diagram: Use Case Diagram Activity Diagram Pilih salah satu aplikasi di bawah: Aplikasi Rental Mobil Aplikasi Pengelolaan Klinik Aplikasi Pengelolaan Apotik Aplikasi Pengelolaan Service Mobil Aplikasi Penjualan Motor Aplikasi Pengelolaan Perpustakaan Aplikasi Penjualan Buku Online Aplikasi Penjualan Tiket Kereta Online Aplikasi Manajemen Universitas Online Aplikasi Penjualan Laptop Online Aplikasi Perpustakaan Digital Aplikasi Pengelolaan Project Software

146
Business Process Realization

147
System Analysis and Design with UML
Business Process Identification Use Case Diagram Business Process Modeling Activity Diagram or Business Process Modeling Notation (BPMN) Business Process Realization Sequence Diagram (Buat untuk setiap use case dengan menggunakan pola Boundary-Control-Entity) System Design Program Design Class Diagram (Gabungkan Boundary-Control-Entity Class dan susun story dari sistem yang dibangun) Package Diagram (Gabungan class yang sesuai, boleh menggunakan pola B-C-E) Deployment Diagram (arsitektur software dari sistem yang dibangun) User Interface Design (Buat UI design dari Boundary Class) Entity-Relationship Model (Buat ER diagram dari Entity Class)
 Business Process Realization. Sequence Diagram (Buat untuk setiap use case dengan menggunakan pola Boundary-Control-Entity) System Design. Program Design. Class Diagram (Gabungkan Boundary-Control-Entity Class dan susun story dari sistem yang dibangun) Package Diagram (Gabungan class yang sesuai, boleh menggunakan pola B-C-E) Deployment Diagram (arsitektur software dari sistem yang dibangun) User Interface Design (Buat UI design dari Boundary Class) Entity-Relationship Model (Buat ER diagram dari Entity Class)")
148
Sequence Diagram

149
Sequence Diagrams Illustrate the objects that participate in a use case Show the messages that pass between objects for a particular use-case over time

150
Sequence Diagram Syntax
AN ACTOR AN OBJECT A LIFELINE A FOCUS OF CONTROL A MESSAGE OBJECT DESTRUCTION anObject:aClass aMessage() x
 x.")
151
Sequence Diagram Susun Sequence Diagram untuk setiap Use Case yang dibuat Mulai dari menarik Actor yang ada di Use Case Diagram, lanjutkan dengan membuat sequence detail dari berjalannya Use Case Catatan: Objek dari Lifeline di Sequence Diagram akan menjadi kandidat Class

152
Jenis Class Boundary Class: Control Class: Entity Class:
Class yang berinteraksi dengan aktor langsung (user interface) Form, input, UI ini masuk di sini Control Class: Class yang berhubungan dengan pemrosesan, penghitungan, kalkulasi, komputasi, query, dst Entity Class: Class yang berhubungan dengan data, penyimpanan data/file
 Form, input, UI ini masuk di sini. Control Class: Class yang berhubungan dengan pemrosesan, penghitungan, kalkulasi, komputasi, query, dst. Entity Class: Class yang berhubungan dengan data, penyimpanan data/file.")
153
Studi Kasus: ATM System

154
Sequence Diagram: Memasukkan Kartu

155
Sequence Diagram: Memasukkan PIN

156
Sequence Diagram: Mengecek Saldo

157
Sequence Diagram: Mentransfer Uang

158
Sequence Diagram: Mengambil Uang

159
Sequence Diagram: Melakukan Logout

160
Exercise: Sequence Diagram
Lihat kembali System Request, Use Case Diagram, dan Activity Diagram yang sudah anda buat Lengkapi diagram tersebut dengan Sequence Diagram untuk setiap Use Case yang dibuat

161
Exercise: Systems Analysis and Design
Object-Oriented Programming Exercise: Systems Analysis and Design Lakukan sistem analysis and design yang menghasilkan diagram: Use Case Diagram Activity Diagram Sequence Diagram Pilih salah satu aplikasi di bawah: Aplikasi Rental Mobil Aplikasi Pengelolaan Klinik Aplikasi Pengelolaan Apotik Aplikasi Pengelolaan Service Mobil Aplikasi Penjualan Motor Aplikasi Pengelolaan Perpustakaan Aplikasi Penjualan Buku Online Aplikasi Penjualan Tiket Kereta Online Aplikasi Manajemen Universitas Online Aplikasi Penjualan Laptop Online Aplikasi Perpustakaan Digital Aplikasi Pengelolaan Project Software

162
Collaboration Diagram

163
Collaboration Diagrams
Essentially an object diagram that shows Message passing relationships Instead associations Emphasize The flow of messages among objects Rather than timing and ordering of messages

164
Collaboration Diagram Syntax
AN ACTOR AN OBJECT AN ASSOCIATION A MESSAGE anObject:aClass aMessage()
")
165
Example Collaboration Diagram

166
State Machine Diagram

167
Behavioral State Machines
Some objects may change states often Some may change state and never change back Patient: new current former This is seen in the cells of the CRUD matrix

168
Behavioral State Machines
The behavioral state machine is a dynamic model that shows this The behavioral state machine shows The different states of an object The events That cause the object to change from one state to another

169
Components of Statechart Diagrams
States Determined by the values of the attributes Events Changes the state of an object e.g. changes the values of attributes

170
Components of Statechart Diagrams
Transitions Movement of an object from one state to another Often has a guard condition Actions Atomic process, takes "zero time" Activities Non-atomic, take a long time, can be started and stopped

171
Statechart Diagram Syntax
A STATE AN INITIAL STATE A FINAL STATE AN EVENT A TRANSITION aState anEvent

172
Example Behavioral State Machine Diagram

173
Building Behavioral State Machine Diagrams
Set the context Identify Initial state Final state All stable states Determine the order in which the object will pass through stable states Identify the events, actions, and guard conditions associated with the transitions Validate the diagram

174
Estimating Project Size with Use Case Points
Gustav Karner (1993)
")
175
Actor and Use Case Weighting Tables
Unadjusted Actor Weighting (UAW) Actor Type Description Weighting Factor Simple External System with well-defined API 1 Average External System using a protocol-based interface, e.g., HTTP, TCT/IP, SQL 2 Complex Human 3 Unadjusted Use Case Weighting (UUCW) Use-Case Type Description Weighting Factor Simple 1-3 transactions 5 Average 4-7 transactions 10 Complex More than 7 transactions 15 Unadjusted Use Case Points (UUCP) = UAW + UUCW
 Actor Type. Description. Weighting Factor. Simple. External System with well-defined API. 1. Average. External System using a protocol-based. interface, e.g., HTTP, TCT/IP, SQL. 2. Complex. Human. 3. Unadjusted Use Case Weighting (UUCW) Use-Case Type. Description. Weighting Factor. Simple. 1-3 transactions. 5. Average. 4-7 transactions. 10. Complex. More than 7 transactions. 15. Unadjusted Use Case Points (UUCP) = UAW + UUCW.")
176
Technical Complexity Factors
Factor Number Description Weight T1 Distributed system 2.0 T2 Response time or throughput performance objectives 1.0 T3 End-user online efficiency T4 Complex internal processing T5 Reusability of code T6 Easy to install 0.5 T7 Ease of use T8 Portability T9 Ease of change Technical Complexity Factor (TCF) = (0.01 * TFactor)
 = (0.01 * TFactor)")
177
Environmental Complexity Factors
Factor Number Description Weight E1 Familiarity with system development process in use 1.5 E2 Application experience 0.5 E3 Object-oriented experience 1.0 E4 Lead analyst capability E5 Motivation E6 Requirements stability 2.0 E7 Part time staff -1.0 E8 Difficulty of programming language Environmental Factor (ECF) = (-0.03 * EFactor)
 = (-0.03 * EFactor)")
178
Computing Use Case Points
Adjusted Use Case Points (UCP) = UUCP * TCF * ECF Effort in Person Hours = UCP * PHM
 = UUCP * TCF * ECF. Effort in Person Hours = UCP * PHM.")
179
Person Hour Multiplier (PHM)
If the sum of (number of Efactors ECF1 through ECF6 assigned value < 3) and (number of Efactors ECF7 and ECF8 assigned value > 3) ≤ 2 PHM = 20 Else If the sum of (number of Efactors ECF1 through ECF6 assigned value < 3) and (number of Efactors ECF7 and ECF8 assigned value > 3) = 3 or 4 PHM 28 Else Rethink project; it has too high of a risk for failure
 and (number of Efactors ECF7 and ECF8 assigned value > 3) ≤ 2 PHM = 20 Else If the sum of (number of Efactors ECF1 through ECF6 assigned value < 3) and (number of Efactors ECF7 and ECF8 assigned value > 3) = 3 or 4 PHM 28 Else Rethink project; it has too high of a risk for failure")
180
Person Hour Multiplier (PHM)
Let F1 = Number of ECF1 to ECF6 that are < 3 Let F2 = Number of ECF7 and ECF8 that are > 3 If F1 + F2 <= 2 PHM = 20 Else if F1 + F2 = 3 or 4 PHM = 28 Else Scrap the project

181
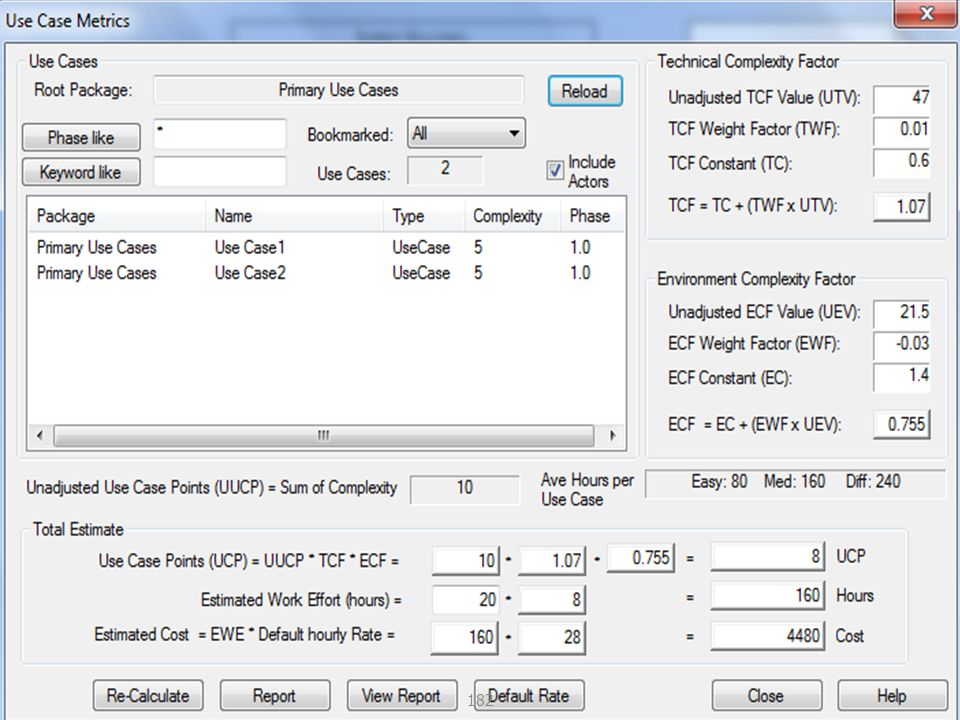
Use Case Points in EA

183
Effort Estimation from PM Defined
Effort Estimation of Sistem ATM UCP = 32 PHM = 20 PH = 20*32 = 640 PM = 640/8/22 = 3.6 PM = 640/10/26 = 2.4 (10 Jam/hari dan sabtu masuk ) TIME (M) = 3.0 * PM 1/3 TIME (M) = 3.0 * 3.4 1/3 TIME (M) = 4.5 TIME (M) = 3.9 (LEMBUR )
 TIME (M) = 3.0 * PM 1/3 TIME (M) = 3.0 * 3.4 1/3 TIME (M) = 4.5 TIME (M) = 3.9 (LEMBUR )")
184
Budget (Custom Software)
Pekerjaan Man-Month Month Budget Total Planning 2 1 Analysis Design Implementation 4 Training

185
Budget (Generic Software)
Product Total LMS Teleconference Chatting eLibrary

186
Exercise: Project Size Estimation
Lihat kembali Use Case Diagram, dan Sequence Diagram yang telah anda buat Estimasi Project Size, Effort dan Time dengan menggunakan Use Case Point

187
Exercise: System Analysis untuk System Request
Lihat kembali System Request yang sudah anda buat Lakukan system analysis dengan membuat diagram di bawah: Use Case Diagram Activity Diagram Sequence Diagram Buat project baru di Sparx EA, buat 3 package dengan nama sama dengan 3 diagram di atas

188
Object-Oriented Programming Referensi Alan Dennis et al, Systems Analysis and Design with UML 4th Edition, John Wiley and Sons, 2013 Kenneth E. Kendall and Julie E Kendall, Systems Analysis and Design 8th Edition, Prentice Hall, 2010 Hassan Gomaa, Software Modeling and Design: UML, Use Cases, Patterns, and Software Architectures, Cambridge University Press, 2011 Gary B. Shelly and Harry J. Rosenblatt, Systems Analysis and Design 9th Edition, Course Technology, 2011 Howard Podeswa, UML for the IT Business Analyst 2nd Edition, Course Technology, 2009 Jeffrey A. Hoffer et al, Modern Systems Analysis and Design 6th Edition, Prentice Hall, 2012

Presentasi serupa