Upload presentasi
Presentasi sedang didownload. Silahkan tunggu

1
Dinamika Perubahan Ekonomi Dunia dilihat dari Perspektif Geografi
Perkembangan kehidupan Perkembangan desa - kota Perubahan demografis Perubahan sektor ekonomi Kuliah Geografi Ekonomi Triarko Nurlambang

2
What is an Economy? A social system that organizes and regulates land, labor and resources for production and determines the distribution of wealth Economic systems determine processes of production, distribution and consumption Economies are social: they regulate relationships between people and between interest groups

3
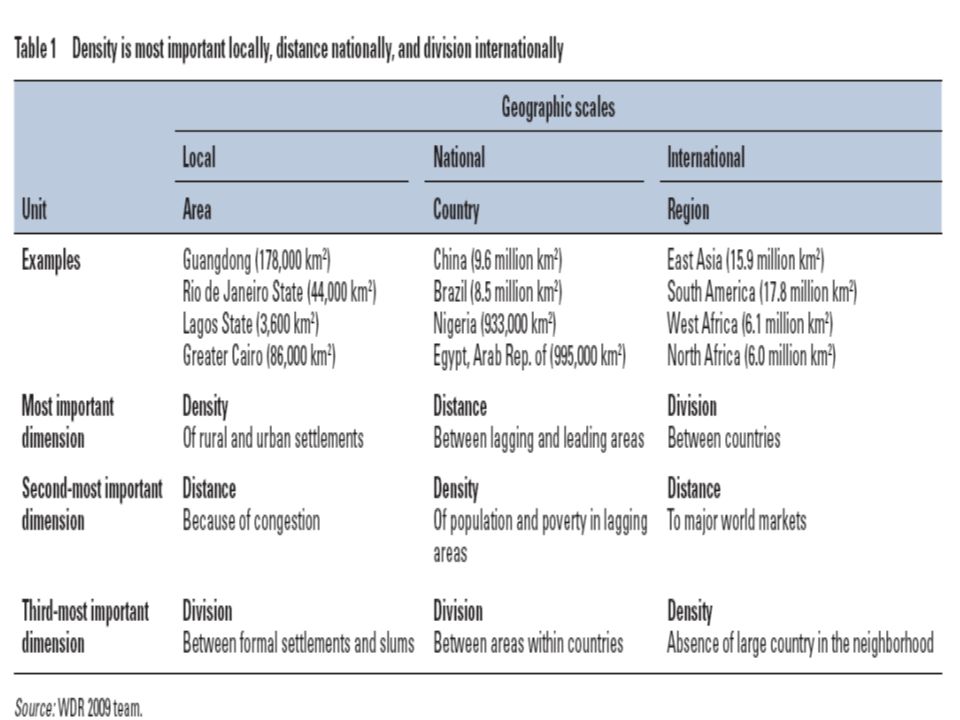
What is a Region? A defined location with known scale (size) and specific extent (scope) A contiguous area with common or complementary characteristics or linked by intensive interaction or flows A working tool to achieve some end related to spatial analysis

4
What is Economic Geography?
Current patterns of economic activity of regions Trends (changes) in economic activity of regions Factors changing the economic activity of regions Current patterns of exchange between regions (include trade, migration and investment) Trends (changes) in exchange between regions Factors changing the exchange between regions
 in economic activity of regions. Factors changing the economic activity of regions. Current patterns of exchange between regions (include trade, migration and investment) Trends (changes) in exchange between regions. Factors changing the exchange between regions.")
5
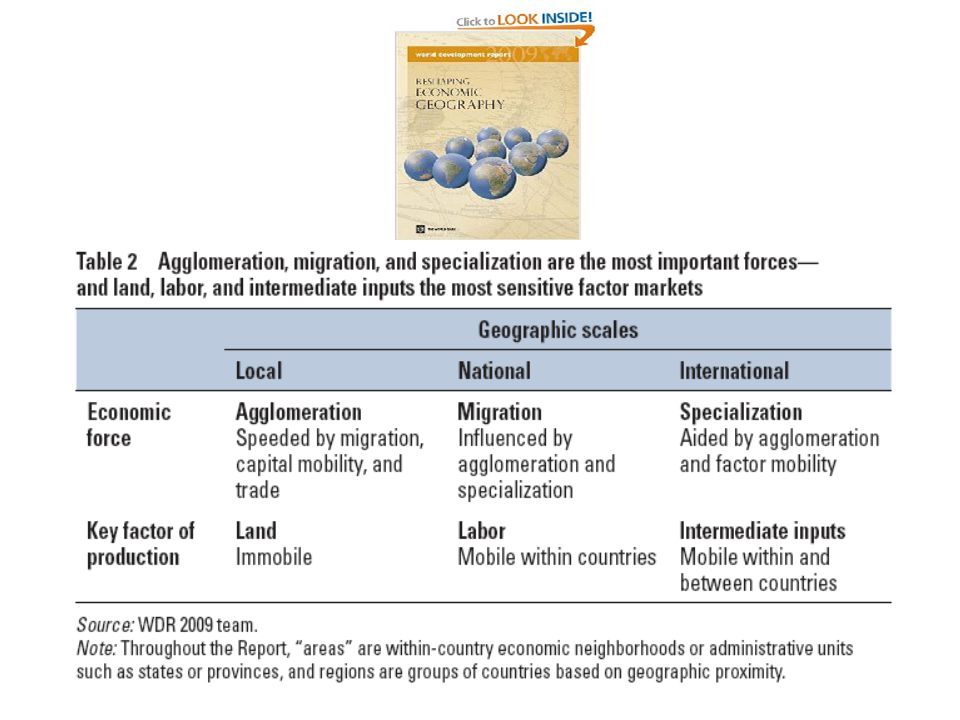
Economies of Scale and Clustering
Clustering efficiencies are external economies of scale Economies of scale are reductions in unit cost as the volume of production increases In production, bigger is better – up to a point External economies are realized by proximity to or ties with others outside the firm

6
Geografi Ekonomi dan Bisnis selalu berubah...
Apalagi yang akan datang ? Hidup dari lingkungan terkonvergnsi Perdagangan regional baru Berburu dan bertani Tata dunia baru (metanasional) Export/ import globalisasi Berdagang / transaksi benda berharga (uang) Berdagang / barter Jaman imperialisme…. Imperialisme gaya baru
 Export/ import. globalisasi. Berdagang / transaksi benda berharga (uang) Berdagang / barter. Jaman imperialisme…. Imperialisme gaya baru.")
7
Apakah kita yakin pola ini akan terjadi lagi?
Cara berpikir LINIER harus diganti dengan HOLISTIK dan berbasis SKENARIO

8
TEORI TRANSISI DEMOGRAFI
(Waren Thompson, 1929) Berkembang Transisi Maju/ stabil
 Berkembang. Transisi. Maju/ stabil.")
9
World’s Largest Countries in 2025
Rank Country Population 1 China 1.43 billion 2 India 1.36 billion 3 United States 346 million 4 Indonesia 272 million 5 Pakistan 252 million 6 Brazil 219 million 7 Nigeria 204 million 8 Bangladesh 181 million 9 Russia 137 million 10 Mexico 131 million 11 Japan 121 million 12 Ethiopia 118 million 13 Philippines 108 million 14 Congo, Democratic Republic of (Zaire) 106 million 15 Vietnam 104 million Rank Country Population 1 China 1.27 billion 2 India 1.03 billion 3 United States 285 million 4 Indonesia 206 million 5 Brazil 172 million 6 Pakistan 145 million 7 Russia 144 million 8 Bangladesh 134 million 9 Japan 127 million 10 Nigeria 11 Mexico 100 million 12 Germany 82 million 13 Vietnam 79 million 14 Philippines 77 million 15 Egypt 70 million
 106 million. 15. Vietnam. 104 million. Rank. Country. Population. 1. China billion. 2. India billion. 3. United States. 285 million. 4. Indonesia. 206 million. 5. Brazil. 172 million. 6. Pakistan. 145 million. 7. Russia. 144 million. 8. Bangladesh. 134 million. 9. Japan. 127 million. 10. Nigeria. 11. Mexico. 100 million. 12. Germany. 82 million. 13. Vietnam. 79 million. 14. Philippines. 77 million. 15. Egypt. 70 million.")
10
Table: World Population, Regional Totals, 0-1998. (000's)
1000 1500 1600 1700 1820 1870 1913 1950 1973 1998 Western Europe 24,700 25,413 57,268 73,778 81,460 132,888 187,532 261,007 305,060 358,390 388,399 Eastern Europe 4,750 6,500 13,500 16,950 18,800 36,415 52,182 79,604 87,289 110,490 121,006 Former USSR 3,900 7,100 20,700 26,550 54,765 88,672 156,192 180,050 249,748 290,866 Western Offshoots (US+) 1,170 1,960 2,800 2,300 1,750 11,230 46,133 111,401 176,094 250,945 323,420 Latin America 5,600 11,400 17,500 8,600 12,050 21,220 39,973 80,515 165,837 308,450 507,623 Japan 3,000 7,500 15,400 18,500 27,000 31,000 34,437 51,672 83,563 108,660 126,469 Asia (except Japan) 171,200 175,400 268,400 360,000 374,800 679,366 730,619 925,932 1,298,296 2,139,154 3,389,943 Africa 16,500 33,000 46,000 55,000 61,000 74,208 90,466 124,697 228,342 387,645 759,954 World 230,820 268,273 437,818 555,828 603,410 1,041,09 1,270,01 1,791,020 2,524,531 3,913,482 5,907,680 Table: World GDP Per Capita, Regional Averages, , 1990 International Dollars 1000 1500 1600 1700 1820 1870 1913 1950 1973 1998 Western Europe 450 400 774 894 1024 1232 1974 3473 4594 11534 17921 Eastern Europe 462 516 566 636 871 1527 2120 4985 5461 Former USSR 500 553 611 689 943 1488 2834 6058 3893 Western Offshoots (US+) 473 1201 2431 5257 9288 16172 26146 Latin America 416 437 529 659 698 1511 2554 4531 5795 Japan 425 520 570 669 737 1387 1926 11439 20413 Asia (except Japan) 572 575 571 543 640 635 1231 2936 Africa 418 444 585 852 1365 1368 World 435 565 593 615 667 867 1510 2114 4104 5709
 1,170. 1,960. 2,800. 2,300. 1, , , , , , ,420. Latin America. 5, , ,500. 8, , , , , , , ,623. Japan. 3,000. 7, , , , , , , , , ,469. Asia (except Japan) 171, , , , , , , ,932. 1,298,296. 2,139,154. 3,389,943. Africa. 16, , , , , , , , , , ,954. World. 230, , , , ,410. 1,041,09. 1,270,01. 1,791,020. 2,524,531. 3,913,482. 5,907,680. Table: World GDP Per Capita, Regional Averages, , 1990 International Dollars Western Europe Eastern Europe Former USSR Western Offshoots (US+) Latin America Japan Asia (except Japan) Africa World")
11
Table: Percent of world economic output.
Table 1.4, Percent of world population 1000 1500 1600 1700 1820 1870 1913 1950 1973 1998 Western Europe 10.7% 9.5% 13.1% 13.3% 13.5% 12.8% 14.8% 14.6% 12.1% 9.2% 6.6% Eastern Europe 2.1% 2.4% 3.1% 3.0% 3.5% 4.1% 4.4% 2.8% 2.0% Former USSR 1.7% 2.6% 3.9% 3.7% 5.3% 7.0% 8.7% 7.1% 6.4% 4.9% Western Offshoots (US+) 0.5% 0.7% 0.6% 0.4% 0.3% 1.1% 3.6% 6.2% 5.5% Latin America 4.2% 4.0% 1.5% 4.5% 7.9% 8.6% Japan 1.3% 3.3% 2.7% 2.9% Asia (except Japan) 74.2% 65.4% 61.3% 64.8% 62.1% 65.3% 57.5% 51.7% 51.4% 54.7% 57.4% Africa 12.3% 10.5% 9.9% 10.1% 9.0% 12.9% Table: Percent of world economic output. 1000 1500 1600 1700 1820 1870 1913 1950 1973 1998 Western Europe 10.8% 8.7% 17.9% 20.0% 22.5% 23.6% 33.6% 33.5% 26.3% 25.7% 20.6% Eastern Europe 1.9% 2.2% 2.5% 2.7% 2.9% 3.3% 4.1% 4.5% 3.5% 3.4% 2.0% Former USSR 1.5% 2.4% 4.4% 5.4% 7.6% 8.6% 9.6% 9.4% Western Offshoots (US+) 0.5% 0.7% 0.3% 0.2% 10.2% 21.7% 30.6% 25.3% 25.1% Latin America 3.9% 1.1% 1.7% 7.9% Japan 1.2% 3.1% 3.0% 2.3% 7.7% Asia (except Japan) 75.2% 67.6% 62.1% 62.8% 57.7% 56.3% 36.0% 21.9% 15.4% 16.4% 29.5% Africa 6.8% 11.8% 7.4% 6.7% 6.6% 3.6% Calculated from table 1.2.
 0.5% 0.7% 0.6% 0.4% 0.3% 1.1% 3.6% 6.2% 5.5% Latin America. 4.2% 4.0% 1.5% 4.5% 7.9% 8.6% Japan. 1.3% 3.3% 2.7% 2.9% Asia (except Japan) 74.2% 65.4% 61.3% 64.8% 62.1% 65.3% 57.5% 51.7% 51.4% 54.7% 57.4% Africa. 12.3% 10.5% 9.9% 10.1% 9.0% 12.9% Table: Percent of world economic output Western Europe. 10.8% 8.7% 17.9% 20.0% 22.5% 23.6% 33.6% 33.5% 26.3% 25.7% 20.6% Eastern Europe. 1.9% 2.2% 2.5% 2.7% 2.9% 3.3% 4.1% 4.5% 3.5% 3.4% 2.0% Former USSR. 1.5% 2.4% 4.4% 5.4% 7.6% 8.6% 9.6% 9.4% Western Offshoots (US+) 0.5% 0.7% 0.3% 0.2% 10.2% 21.7% 30.6% 25.3% 25.1% Latin America. 3.9% 1.1% 1.7% 7.9% Japan. 1.2% 3.1% 3.0% 2.3% 7.7% Asia (except Japan) 75.2% 67.6% 62.1% 62.8% 57.7% 56.3% 36.0% 21.9% 15.4% 16.4% 29.5% Africa. 6.8% 11.8% 7.4% 6.7% 6.6% 3.6% Calculated from table")
12
Sejarah Ekonomi Indonesia (1)
Fakta Dasar Indonesia adalah negara kepulauan yang terletak di Asia Tenggara. Terdiri dari kurang-lebih pulau dengan pulau Sumatera, Jawa, Kalimantan, Sulawesi, Papua adalah pulau-pulau yang besar diapit oleh Samudera Hindia dan Pasifik. Luas total Indonesia yaitu 1,9 juta km2. Indonesia memiliki iklim tropik dengan rangakain pegunungan vulkanik dan merupakan tempat pertemuan tiga lempeng dunia. Oleh karenanya Indonesia mempunyai lahan yang relatif subur dan kaya akan bahan tambang, seperti minyak dan gas, timah, bauxute, nickel, batu bara, tembaga, emas dan perak. Sampai dengan tahun 2006 jumlah penduduk Indonesia hampir mencapai 240 juta dengan konsentrasi di pulau Jawa (hampir 60%). Table 1 Indonesia's Gross Domestic Product per Capita Compared with Several Other Asian Countries (in 1990 dollars) Indonesia Philippines Thailand Japan 1900 745 1 033 812 1 180 1913 904 1 066 835 1 385 1950 840 1 070 817 1 926 1973 1 504 1 959 1 874 11 439 1990 2 516 2 199 4 645 18 789 2000 3 041 2 385 6 335 20 084 Source: Angus Maddison, The World Economy: A Millennial Perspective, Paris: OECD
. Table 1. Indonesia s Gross Domestic Product per Capita Compared with Several Other Asian Countries (in 1990 dollars) Indonesia. Philippines. Thailand. Japan Source: Angus Maddison, The World Economy: A Millennial Perspective, Paris: OECD.")
13
Sejarah Ekonomi Indonesia (2)
Pra-kolonial (Sriwijaya, Majapahit, Mataram) Awal Kolonial (abad 16-17) Kolonial (abad 19) VOC; cultivation system, perdagangan modern Ekonomi Ekspor ( ) Post-1945 Orde Baru pertumbuhan ek. Reformasi (?) krisis finan sial Financial Results of Government Cultivation, ('Cultivation System') (in thousands of guilders in current values) Coffee 40 278 24 549 Sugar 8 218 4 136 Indigo, 7 836 7 726 Pepper, Tea 647 1 725 Total net profits 39 341 35 057 Source: Fasseur 1975: 20.
 Awal Kolonial (abad 16-17) Kolonial (abad 19) VOC; cultivation system, perdagangan modern. Ekonomi Ekspor ( ) Post Orde Baru pertumbuhan ek. Reformasi ( ) krisis finan. sial. Financial Results of Government Cultivation, ( Cultivation System ) (in thousands of guilders in current values) Coffee Sugar Indigo, Pepper, Tea Total net profits Source: Fasseur 1975: 20.")
14
World Migration Routes Since 1700
European African (slaves) Indian Chinese Japanese Majority of population descended from immigrants
 Indian. Chinese. Japanese. Majority of population descended from immigrants.")
15
Long Wave Cycles of Innovation
Water power Textiles Iron Steam Rail Steel Electricity Chemicals Internal-combustion engine Petrochemicals Electronics Aviation Digital networks Software New Media Pace of innovation 1st Wave 2nd Wave 3rd Wave 4th Wave 5th Wave 1785 Source: Adapted from the Economist, Feb 20th 1999. 60 years 1845 55 years 1900 50 years 1950 40 years 1990 30 years

16
Kumulatif Sumbangan Moda Transportasi terhadap Peluang Ekonomis
Revolusi Industrial Produksi Massal Globalisasi Telekomunikasi Udara Jalan darat Peluang Ekonomis Kereta Api Source: adapted from HOP Associates (2005) “Time, mobility and economic growth”, Kapal Penyeberangan Kapal Laut Kuda 1750 1775 1800 1825 1850 1875 1900 1925 1950 1975 2000 2025 2050
 Time, mobility and economic growth , Kapal Penyeberangan. Kapal Laut. Kuda")
17
Core-Periphery Stages of Development in a Urban System
1 2 Core Periphery Periphery 3 Source: adapted from Friedmann, J. (1966) Regional Development Policy: A Case Study of Venezuela, Cambridge, Mass.: MIT Press. 4
 Regional Development Policy: A Case Study of Venezuela, Cambridge, Mass.: MIT Press. 4.")
18
Future Growth: Developed and Developing Countries
Developing country urban urban rural rural

19
Rank / Size of the World’s 25 Largest Cities, 2000
Source: United Nations.

20
Sectors of the Economy Percent of Workforce Time Tertiary Secondary
Quaternary Primary Time

24
Poles of the Global Economy
Western Europe North America East Asia Economies Underdeveloped Developing Newly Industrializing Advanced Oil Export / Rent

25
Core / Periphery Division of the World
Semi-Periphery Core

26
Apa saja faktor utama penggerak perubahan masa depan?
Pertumbuhan penduduk secara eksponensial Speed of innovation (accelerating) tren teknologi dan (ICT, robotic/nano), ilmu pengetahuan dasar (biologi/bio-tech, fisika-materi, kimia) Batas industri dan penelitian-pengembangan (R & D) menjadi tambah kabur
 tren teknologi dan (ICT, robotic/nano), ilmu pengetahuan dasar (biologi/bio-tech, fisika-materi, kimia) Batas industri dan penelitian-pengembangan (R & D) menjadi tambah kabur.")
27
Beberapa contoh hasil prediksi masa depan
Berdasarkan studi J.R. Mooneyham 2006 Wireless LAN 2008 Nanocomputer elements 2010 Optical cards menggantikan floppy disk 2015 Mendengarkan musik 6 hari dalam satu chip 2035 Super-jumbo jets membawa 1500 penumpang 2038 NASA mengirim orang pertama ke Mars 2050 Bertamasya ke luar angkasa 2058 Implan otak buatan meningkatkan kemampuan intelijen 2064 Otak buatan terkoneksi dengan komputer 2073 Kota bawah tanah terbangun 2087 Ekosistem di re-boot 2088 Muncul banyak spesies baru 2150 Bermunculan non-biologis yang bisa berpikir 2300 Ada kuda diangkasa 2450 Ditemukan the “United State of Earth” 2500 Pemukiman baru di Mars Siklus Kondratieff yang menjelaskan siklus 60 tahunan atas dasar adanya perubahan radikal dalam teknologi sehingga menciptakan satu bentuk kehidupan baru Tren ketenagakerjaan dikembangkan oleh Leo A. Nefiodow) dimana sektor pertanian akan mengalami kemunduran dan sektor jasa menjadi semakin utama Tren teknologi yang dikembangkan oleh Gartner (Hype Cycle) dan Moore (Moore’s Lawn perkembang microelectronics; dunia menjadi terkonvergensidan siklus perubahan semakin pendek
 dimana sektor pertanian akan mengalami kemunduran dan sektor jasa menjadi semakin utama. Tren teknologi yang dikembangkan oleh Gartner (Hype Cycle) dan Moore (Moore’s Lawn perkembang microelectronics; dunia menjadi terkonvergensidan siklus perubahan semakin pendek.")
28
Munculnya pola kehidupan yang baru Cara baru menjalankan bisnis
Manajemen kesehatan Jasa perbaikan Jasa dokter kesehatan Waktu luang dan hiburan Dunia Maya/ virtual Model baru sekolah Pelatihan individual Pelatihan profesional KEHIDUPAN BARU Faktor pendorong masa depan: keamanan & kepercayaan, penghematan biaya-waktu, bertmabahnya kenyamanan, dan perbaikan kualitas hidup Faktor penghambat: kompleksitas, tiadanya standard dan layanan buruk Faktor pengubah: teknologi Pembelajaran Monitoring Lingkungan hidup Rancang produk Eksplorasi Proses material Recyclability Lingkungan dan perang Aplikasi Proteksi lingkungan Prosesi informasi Pelatihan Pakaian seragam Militer Fungsi konsep strategi Portal sbg gerbang dunia E-customer bonding E-business di industri Pengganti lokasi pasar Cara baru menjalankan bisnis Bisnis elektronik Real Time Business Internet dalam peralatan mobil MMS Pembayaran elektronik Permintaan pelanggan Mobile business

30
Selected Key regional priority issues (environmental dev.)
Africa: Land degradation and its cross-cutting impacts on forests, freshwater, marine and coastal resources, as well as pressures such as drought, climate variability and change, and urbanization Asia and the Pacific: Transport and urban air quality, freshwater stress, valuable ecosystems, agricultural land use, and waste management Europe: Climate change and energy, unsustainable production and consumption, air quality and transport, biodiversity loss and land-use change, and freshwater stress Latin America and the Caribbean: Growing cities, biodiversity and ecosystems, degrading coasts and polluted seas, and regional vulnerability to climate change North America: Energy and climate change, urban sprawl and freshwater stress West Asia: Freshwater stress, land degradation, degrading coasts and marine ecosystems, urban management, and peace and security Polar Regions: Climate change, persistent pollutants, the ozone layer, and development and commercial activity

Presentasi serupa


>")
>")


 Kenaikan Muka Laut (m) 2010 7,4080.4 205030,1200.56 210090,2601.1 Sumber : Susandi,dkk.>")


.>")
