Upload presentasi
Presentasi sedang didownload. Silahkan tunggu

1
Distribusi Probabilitas Kontinu()
")
2
Why Use..? Continuous random variables,such as heights and weights, length of life of a particular product, or experimental laboratory error, can assume the infinitely many values corresponding to points on a line interval. If you try to assign a positive probability to each of these uncountable values, the probabilities will no longer sum to 1, as with discrete random variables. Therefore, you must use a different approach to generate the probability distribution for a continuous random variable.

3
Suppose you have a set of measurements on a continuous random variable, and you
create a relative frequency histogram to describe their distribution. For a small number of measurements, you could use a small number of classes; then as more and more measurements are collected, you can use more classes and reduce the class width. The outline of the histogram will change slightly, for the most part becoming less and less irregular, as shown in Figure 6.1. As the number of measurements becomes very large and the class widths become very narrow, the relative frequency histogram appears more and more like the smooth curve shown in Figure 6.1(d). This smooth curve describes the probability distribution of the continuous random variable.
. This smooth curve. describes the probability distribution of the continuous random variable.")
4
Jika pada dist. Diskret jumlah semua peluang adalah 1, pada dist
Jika pada dist. Diskret jumlah semua peluang adalah 1, pada dist. Kontinu area, area dibawah kurva adalah 1

5
Distribusi Normal/Gauss
Fungsi Kepekatan Distribusi Normal

6
Distribusi Normal/Gauss
Kurva dari fungsi kepekatan distribusi normal akan berbentuk genta atau Lonceng dan simetris terhadap rata-rata The mean m locates the centerof the distribution, and the distribution is symmetricabout its mean m. Since the total area under the normal probability distribution is equal to 1, this symmetry implies that the area to the right of miu is .5 and the area to the left of miu also .5.

7
Distribusi Normal/Gauss
Bentuk kurva normal sangat dipengaruhi oleh besar kecilnya rata-rata (miu) dan simpangan baku (sigma). Makin kecil simpangan baku (sigma), bentuk kurva semakin runcing dan sebagian besar nilai-nilai X mengumpul mendekati rata-rata ( miu ), dan sebaliknya bila sigma makin besar, bentuk kurva semakin tumpul dan nilai-nilai X letaknya makin jauh dari rata-rata ( miu ),
 dan simpangan baku (sigma). Makin kecil simpangan baku (sigma), bentuk kurva semakin runcing dan sebagian besar nilai-nilai X. mengumpul mendekati rata-rata ( miu ), dan sebaliknya bila sigma makin besar, bentuk kurva. semakin tumpul dan nilai-nilai X letaknya makin jauh dari rata-rata ( miu ),")
8
Distribusi Normal/Gauss

9
Distribusi Normal/Gauss

10
Distribusi Normal/Gauss
Berlaku aturan Empiris bagi Dist. Normal

11
Distribusi Normal Baku
Digunakan untuk menghitung peluang distribusi Normal. Distribusi normal (sebaran normal) bisa dirubah menjadi distribusi normal baku dengan jalan merubah variabel acak X menjadi variabel acak Z, dengan rumus sebagai berikut : Distribusi Normal Baku adalah distribusi normal dengan nilai rata-rata sama dengan nol (miu = 0) dan simpangan baku sama dengan satu (sigma = 1). From the formula for z,we can draw these conclusions: • When x is less than the mean miu, the value of z is negative. • When x is greater than the mean miu, the value of z is positive. • When x=miu, the value of z=0.
 bisa dirubah menjadi distribusi normal baku dengan jalan merubah variabel acak X menjadi variabel acak Z, dengan rumus sebagai berikut : Distribusi Normal Baku adalah distribusi normal dengan nilai rata-rata sama. dengan nol (miu = 0) dan simpangan baku sama dengan satu (sigma = 1). From the formula for z,we can draw these conclusions: • When x is less than the mean miu, the value of z is negative. • When x is greater than the mean miu, the value of z is positive. • When x=miu, the value of z=0.")
12
Distribusi Normal Baku
Kurva tsb disebut dist. Normal baku karena mean=0, Values of z on the left side of the curve are negative, while values on the right side are positive. Untuk menghitung peluang tsb, digunakan tabel distribusi normal baku, atau tabel Z.

14
Distribusi Normal Baku

15
Distribusi Normal Baku
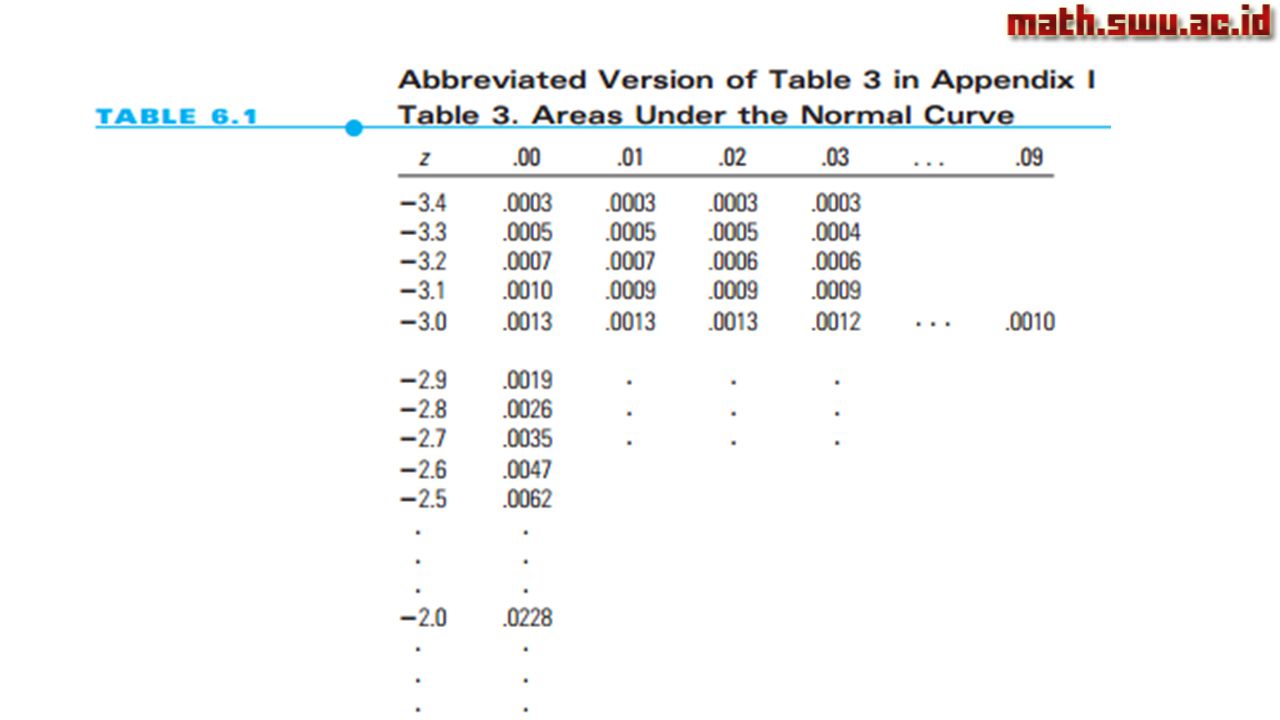
Tabel z adalah peluang dari daerah dibawah kurva ke kiri

16
Tabel z adalah peluang dari daerah dibawah kurva ke kiri

17
Kerjakan

21
Kerjakan P( -2 < z < 0.8 ) P( z > -1)
 P( z > -1)")
22
Pendekatan Dist. Normal untuk Dist. Binomial

23
Pendekatan Dist. Normal untuk Dist. Binomial

24
Pendekatan Dist. Normal untuk Dist. Binomial

25
Pendekatan Dist. Normal untuk Dist. Binomial

26
Pendekatan Dist. Normal untuk Dist. Binomial

27
Pendekatan Dist. Normal untuk Dist. Binomial

28
Distribusi Normal Baku dengan Ms. Excel

29
Distribusi Normal Baku dengan Ms. Excel
Untuk menemukan P(X < Z) = 0.025, gunakan function NORMSINV Karena 0,025 ke kanan, maka cari 1-0,025=0,975 ke kiri
 = 0.025, gunakan function NORMSINV. Karena 0,025 ke kanan, maka cari 1-0,025=0,975 ke kiri.")
30
Distribusi Normal dengan Ms. Excel

31
Distribusi Normal dengan Ms. Excel

32
Distribusi Normal dengan Ms. Excel

Presentasi serupa
 © 2006 Prentice-Hall, Inc. Chap 6-1 Bab 6 Distribusi Normal.>")


>")


 ke ruang bilangan riil (wilayah fungsi). Fungsi peubah.>")

>")


