Upload presentasi
Presentasi sedang didownload. Silahkan tunggu

3
Control Chart Selection
Quality Characteristic variable attribute defective defect no n>1? x and MR constant sampling unit? yes constant sample size? yes p or np no n>=10 or computer? x and R yes no no yes p-chart with variable sample size c u x and s

4
Comparison of Variables v. Attributes
Fit certain cases. Both mean and variation information. More expensive? Identify mean shifts sooner before large number nonconforming. Attributes Fit certain cases – taste, color, etc. Larger sample sizes. Provides summary level performance. Must define nonconformity. Atribut : karakteristik kualitas yg sesuai spesifikasi atau tidak Atribut dipakai jk ada pengukuran yg tidak mungkin dilakukan ( tidak dibuat) spt : goresan,apel yg busuk, kesalahan warna, ada bagian yg hilang
 spt : goresan,apel yg busuk, kesalahan warna, ada bagian yg hilang.")
6
Types of Control Control Chart Monitors Attribute control charts
p chart Process fraction defective c chart number of defects u chart defects per unit Variables control charts X-bar chart Process mean R chart (Range Chart) Process variability
 Process variability.")
7
When are Shifts Detected ?
Lower Specification Limit LCL UCL Upper Process Target Nonconformity Control Chart Identifies Mean Shift Here Attribute Chart Identifies

8
Variables v. Attributes
Both have advantages. At High levels - Attribute charts, identify problem areas. At Lower levels – Variables charts, quantitative problem solving tools. Dapat diterapkan di semua tgkt organisasi , separtemen, pusat kerja dan mesin operasional (tgk tertinggi – terendah) Membantu identifikasi permasalahan ( umum dan detil) _ Tdk dapat diketahui sbrp jauh ketidaktepatan dg spesifikasi tsb Ukuran sampel yg besar akan bermasalah jk pengukurannya mahal dan destruktif
 Membantu identifikasi permasalahan ( umum dan detil) _. Tdk dapat diketahui sbrp jauh ketidaktepatan dg spesifikasi tsb. Ukuran sampel yg besar akan bermasalah jk pengukurannya mahal dan destruktif.")
9
Ch 12- Control Charts for Attributes
p chart – fraction defective np chart – number defective c, u charts – number of defects Berdasar Distribusi BINOMIAL Kelompok pengendali unit ketidaksesuaian Dinyatakan dalam proporsi (%) p dan np Chart Menunjukkan proporsi ketidaksesuaian dalam sampel / sub kelompok Berdasar Distribusi POISSON bagian ketidaksesuaian dalam unit inspeksi Berkaitan dg kombinasi ketidaksesuaian berdasar BOBOT yg dipengaruhi banyak sedikitnya ketidaksesuaian c- Chart dan u-chart
 p dan np Chart. Menunjukkan proporsi ketidaksesuaian dalam sampel / sub kelompok. Berdasar Distribusi POISSON. bagian ketidaksesuaian dalam unit inspeksi. Berkaitan dg kombinasi ketidaksesuaian berdasar BOBOT yg dipengaruhi banyak sedikitnya ketidaksesuaian. c- Chart dan u-chart.")
10
Defect vs. Defective ‘Defect’ – a single nonconforming quality characteristic. ‘Defective’ – items having one or more defects.

11
Legal Concerns with Term ‘Defect’
Often called ‘nonconformity’. Possible Legal Dialog Does your company make a lot of ‘defects’? Enough to track them on a chart ? If they are not ‘bad’, why do you call them ‘defects’, sounds bad to me. So you knowingly track and ship products with ‘defects’?

12
Summary of Control Chart Types and Limits Table 12.3
These are again ‘3 sigma’ control limits

13
p, np - Chart Charts based on Binomial distribution.
P is fraction nonconforming. np is total nonconforming. Charts based on Binomial distribution. Sample size must be large enough (example p=2%) Definition of a nonconformity. Probability the same from item to item. P adalah fraksi yang tidak sesuai. np adalah total yang tidak sesuai. Grafik berdasarkan distribusi Binomial. Ukuran sampel harus cukup besar (misalnya p = 2%) Definisi ketidaksesuaian. Probabilitas yang sama dari item ke item.
 Definition of a nonconformity. Probability the same from item to item. P adalah fraksi yang tidak sesuai. np adalah total yang tidak sesuai. Grafik berdasarkan distribusi Binomial. Ukuran sampel harus cukup besar (misalnya p = 2%) Definisi ketidaksesuaian. Probabilitas yang sama dari item ke item.")
14
c, u - Charts c and u charts deal with nonconformities.
c Chart – total number of nonconformities. u Chart – nonconformities per unit. Charts based on Poisson distribution. Sample size, constant probabilities.

19
How to Interpret Attribute Charts
Points beyond limits- primary test. Below lower limits means process has improved. Zone rules do not apply. Rules for trends, shifts do apply. Only get One Chart !!

20
Examples of When to Use p,np charts– c,u charts-
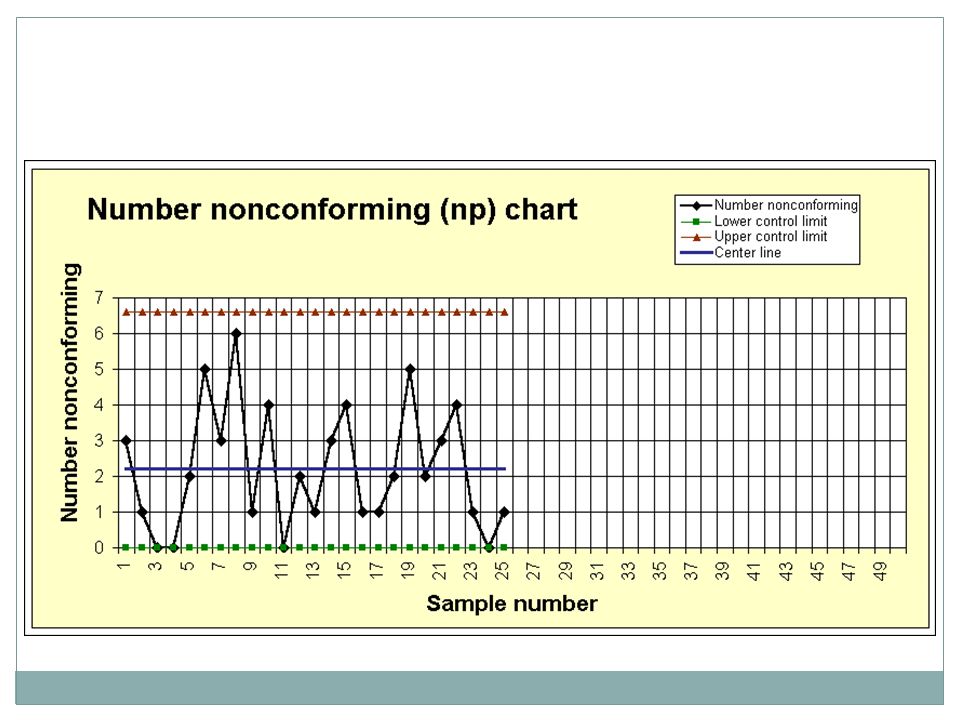
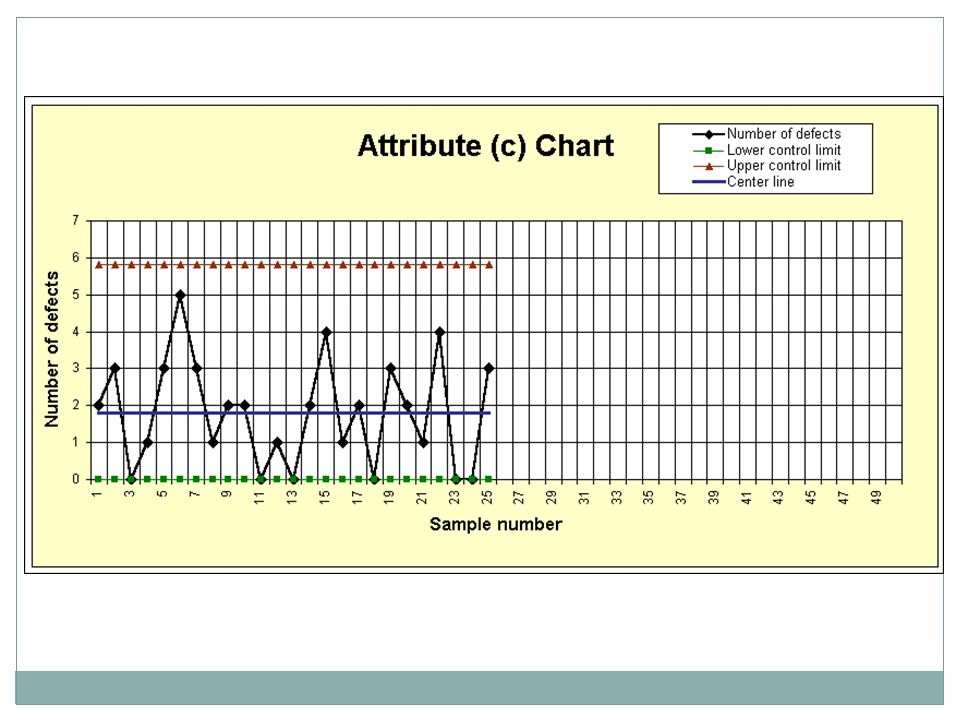
Number of nonconforming cables is found for 20 samples of size 100. Number of nonconforming floppy disks is found for samples of 200 for 25 trials. c,u charts- Number of paint blemishes on auto body observed for 30 samples. Number of imperfections in bond paper – by area inspected and number of imperfections.

21
p-chart Jika bohlam tidak menyala, lampu yang rusak Perusahaan ingin
Perkirakan persentase bohlam rusak dan Tentukan apakah persentase bohlam rusak terus meningkat dari waktu ke waktu.. Sebuah peta kendali p adalah alat yang sesuai untuk menyediakan perusahaan dengan informasi ini. .

22
Number of samples (subgroups) = k = 5
Notation Sample size = n = 100 Number of samples (subgroups) = k = 5 X = number of defective bulbs in a sample p = sample fraction defective = ??? p-bar = estimated process fraction defective P = process fraction defective (unknown) p-bar is an estimate of P Ukuran sampel = n = 100 Jumlah sampel (subkelompok) = k = 5 X = jumlah lampu yang rusak dalam sampel p = fraksi sampel rusak =??? p-bar = fraksi proses diperkirakan rusak P = Proses fraksi cacat (tidak diketahui) p-bar adalah perkiraan P
 = k = 5. X = number of defective bulbs in a sample. p = sample fraction defective = p-bar = estimated process fraction defective. P = process fraction defective (unknown) p-bar is an estimate of P. Ukuran sampel = n = 100 Jumlah sampel (subkelompok) = k = 5 X = jumlah lampu yang rusak dalam sampel p = fraksi sampel rusak = p-bar = fraksi proses diperkirakan rusak P = Proses fraksi cacat (tidak diketahui) p-bar adalah perkiraan P.")
23
Inspection Results

24
Compute p and p-bar

25
p-bar (Estimated Process Fraction Defective)
")
26
p-Chart Control Limits

27
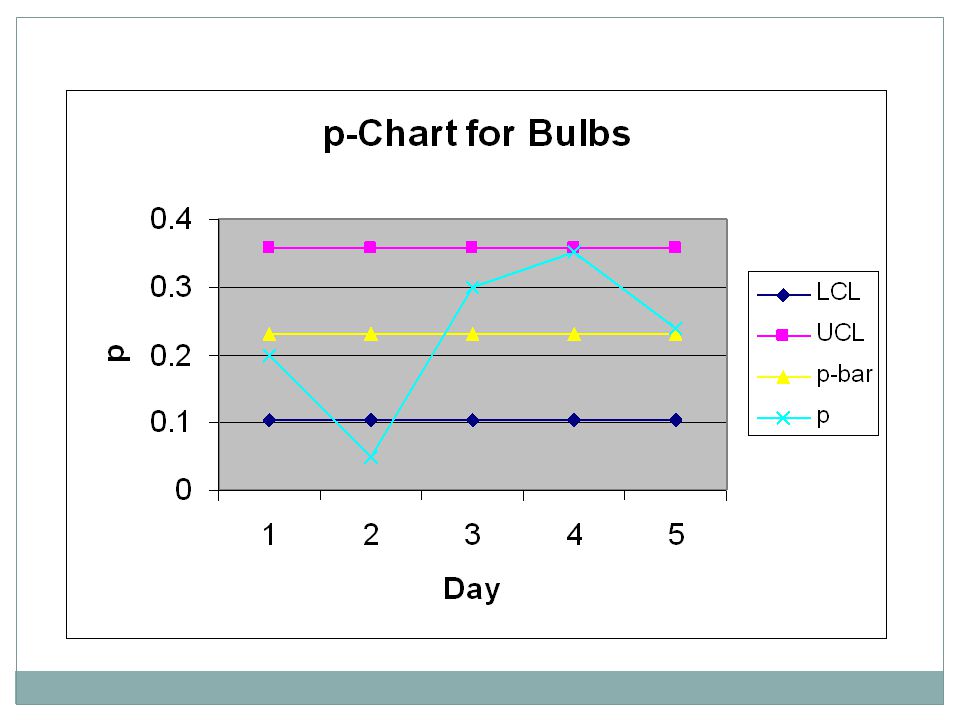
p-Chart - Control Limits

29
Interpretation The estimated fraction of defective bulbs produced is .23. On Day 2, p was below the LCL. This means that a special cause occurred on that day to cause the process to go out of control. The special cause shifted the process fraction defective downward. This special cause was therefore favorable and should be ??? Fraksi diperkirakan lampu cacat yang dihasilkan adalah .23. Pada Hari 2, p berada di bawah LCL. Ini berarti bahwa penyebab khusus terjadi pada hari itu menyebabkan proses untuk keluar dari kontrol. Penyebab khusus menggeser proses fraksi cacat ke bawah. Ini menyebabkan khusus karena itu menguntungkan dan harus???

30
Interpretation After Day 2, the special cause lost its impact because on Day 4, the process appears to be back in control and at old fraction defective of .23. Until the special cause is identified and made part of the process, the process will be unstable and unpredictable. It is therefore impossible to obtain a statistical valid estimate of the process fraction defective because it can change from day to day. Setelah Hari 2, penyebab khusus kehilangan dampaknya karena pada Hari 4, proses tampaknya akan kembali memegang kendali dan pada fraksi tua rusak .23. Sampai penyebab khusus diidentifikasi dan dijadikan bagian dari proses, proses akan tidak stabil dan tak terduga. Oleh karena itu tidak mungkin untuk mendapatkan perkiraan yang valid statistik dari fraksi proses cacat karena dapat berubah dari hari ke hari.

31
Trend Within Control Limits
Process fractions defective is shifting (trending) upward P = process fraction defective P P Sampling Distribution P P UCL LCL p-Chart
 upward. P = process. fraction. defective. P. P. Sampling. Distribution. P. P. UCL. LCL. p-Chart.")
32
Think of an application of a p-chart in:
Applications Think of an application of a p-chart in: Sales Shipping department Law

33
Use of c-Charts When we are interested in monitoring number of defects on a given unit of product or service. Scratches, chips, dents on an airplane wing Errors on an invoice Pot holes on a 5-mile section of highway Complaints received per day Opportunity for a defect must be infinite. Probability of a defect on any one location or any one point in time must be small. Ketika kita tertarik pada pemantauan jumlah cacat pada unit tertentu produk atau jasa. Goresan, keripik, penyok pada sayap pesawat Kesalahan pada faktur Pot lubang pada bagian 5 mil dari jalan raya Keluhan yang diterima per hari Kesempatan untuk cacat harus terbatas. Probabilitas sebuah cacat pada satu lokasi atau satu titik waktu harus kecil.

34
c-Chart c-chart notation: c = number of defects k = number of samples

35
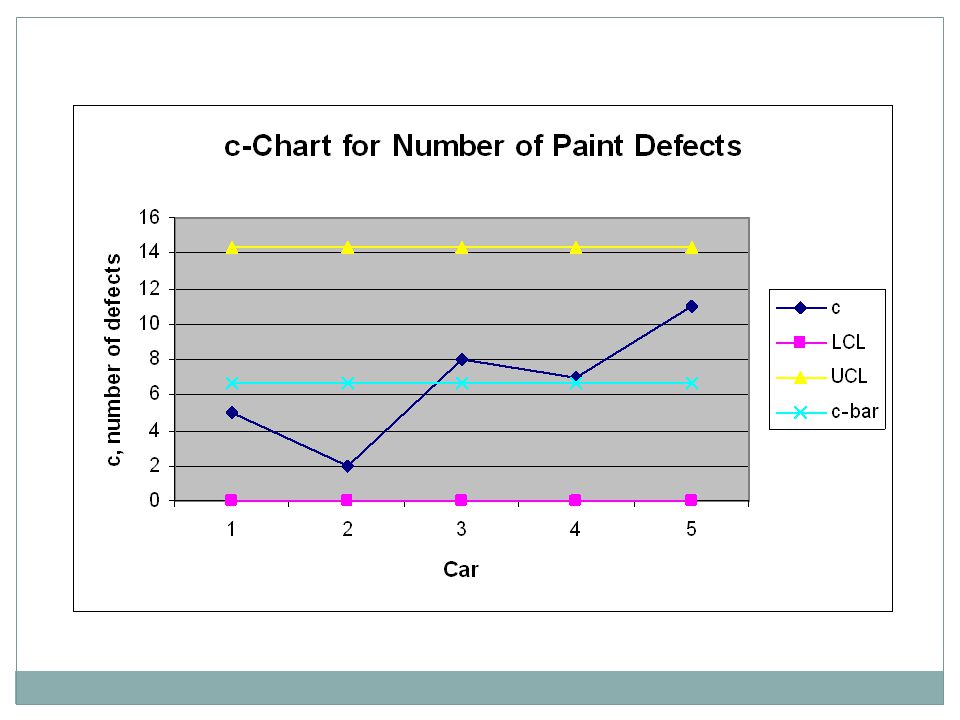
c-Chart A car company wants to monitor the number of paint defects on a certain new model of one of its cars. Each day one car in inspected. The results after 5 days are shown on the next slide. Sebuah perusahaan mobil ingin memantau jumlah cacat cat pada model baru tertentu dari salah satu mobil tersebut. Setiap mobil suatu hari di diperiksa. Hasil setelah 5 hari ditampilkan pada slide berikutnya.

36
c-Chart

37
c-Chart - Mean

38
c-Chart – Control Limits

39
c-Chart – Control Limits

41
Conclusion Process shows upward trend.
Even though trend is within the control limits, the process is out of control. Mean is shifting upward This is due to an unfavorable special cause. Must identify special cause and eliminate it from process. Who is responsible for finding and eliminating special cause? Proses menunjukkan tren yang meningkat. Meskipun tren berada dalam batas kendali, proses ini di luar kontrol. Mean bergeser ke atas Hal ini disebabkan oleh sebab khusus yang tidak menguntungkan. Harus mengidentifikasi penyebab khusus dan menghilangkan dari proses. Siapa yang bertanggung jawab untuk mencari dan menghilangkan sebab khusus?

42
Mini Case Think of an application of a c-chart bank.

43
u-Chart With a c chart, the sample size is one unit. A u-chart is like a c-chart, except that the sample size is greater than one unit. As a result, a u-chart tracks the number of defects per unit. A c-chart monitors the number of defects on one unit.

44
The results are shown on next side.
u-Chart A car company monitors the number of paint defects per car by taking a sample of 5 cars each day over the next 6 days. The results are shown on next side.

45
u-Chart

46
u-Chart

47
u-Chart

48
u-Chart

49
u-Chart

50
Conclusion The process appears stable.
We can therefore get a statistically valid estimate the process mean number of defects per car. Our estimate of the mean number of paint defects per car is 10.5, the center line on the control chart. Thus, we expect each car to have, on average, 10.5 paint defects. Proses itu muncul stabil. Oleh karena itu kita bisa mendapatkan statistik yang valid memperkirakan proses rata-rata jumlah cacat per mobil. Kami memperkirakan jumlah rata-rata cacat cat per mobil adalah 10,5, garis tengah pada peta kendali. Jadi, kami berharap mobil masing-masing memiliki rata-rata 10,5 cacat cat.

51
Conclusion Although the process is stable, the number of defects per car is too high. Deming calls this a stable process for the production of defective product. Important take away: A stable process (process in control) is not necessarily a good process because it can be in control at the wrong level. A stable process is predictable, but this doesn’t mean that what is being predicted is favorable. Meskipun proses stabil, jumlah cacat per mobil terlalu tinggi. Deming menyebutnya suatu proses yang stabil untuk produksi produk cacat. Penting mengambil: Sebuah proses yang stabil (proses di kontrol) tidak selalu merupakan proses yang baik karena dapat di kontrol di tingkat yang salah. Sebuah proses yang stabil diprediksi, tetapi ini tidak berarti bahwa apa yang diperkirakan adalah menguntungkan.
 is not necessarily a good process because it can be in control at the wrong level. A stable process is predictable, but this doesn’t mean that what is being predicted is favorable. Meskipun proses stabil, jumlah cacat per mobil terlalu tinggi. Deming menyebutnya suatu proses yang stabil untuk produksi produk cacat. Penting mengambil: Sebuah proses yang stabil (proses di kontrol) tidak selalu merupakan proses yang baik karena dapat di kontrol di tingkat yang salah. Sebuah proses yang stabil diprediksi, tetapi ini tidak berarti bahwa apa yang diperkirakan adalah menguntungkan.")
52
Mini Case Who is responsible for improving this process?
What is required to improve the process?

53
u-Chart vs. c-Chart If n = 1, u = c and
Control limits of the two chart will therefore be the same.

54
Sample Size Control Chart When To Use Sample Size p-Chart
Monitor the proportion of defectives in a process At least 50 c-Chart Monitor the number of defects 1 u-chart Monitor the number of defects per unit >1

55
In Practice Special cause is identified
You need 25 to 30 samples before computing initial control limits. When a special cause occurs, you should eliminate that sample and re-compute control limits if Special cause is identified Eliminated or made part of process To identify special causes, workers must keep log sheet, where they record any changes they make to the process. Anda perlu 25 hingga 30 sampel sebelum komputasi batas kendali awal. Ketika penyebab khusus terjadi, Anda harus menghilangkan bahwa sampel dan kembali menghitung batas kendali jika Penyebab khusus diidentifikasi Dieliminasi atau dibuat bagian dari proses Untuk mengidentifikasi penyebab khusus, pekerja harus menjaga lembar log, di mana mereka merekam setiap perubahan yang mereka buat proses.

56
Tracking Improvements
UCL LCL Process not centered and not stable Process centered and stable Additional improvements made to the process
![]()
57
Sampel SAMA…p chart Proporsi diketahui Garis Tengah = p¯

58
Sampel SAMA…p chart Proporsi TIDAK diketahui Garis Tengah = p¯
m nomer sampel (vertikal) n ukuran sampel (horisontal) D bagian tidak sesuai p¯ = ∑Di/(mn) Garis Tengah = p¯
 n ukuran sampel (horisontal) D bagian tidak sesuai. p¯ = ∑Di/(mn) Garis Tengah = p¯")
59
Sampel BEDA … Metode INDIVIDU Batas Kendali tergantung ukuran sample tertentu shg BKA/BKB tidak berupa garis LURUS Metode RATA_RATA Ukuran sampel RATA -RATA dg perbedaan tidak terlalu besar ( n¯ = ∑n/observasi) Peta Kendali TERSTANDAR dg GT=0 dan BK ± 3
 Peta Kendali TERSTANDAR dg GT=0 dan BK ± 3.")
60
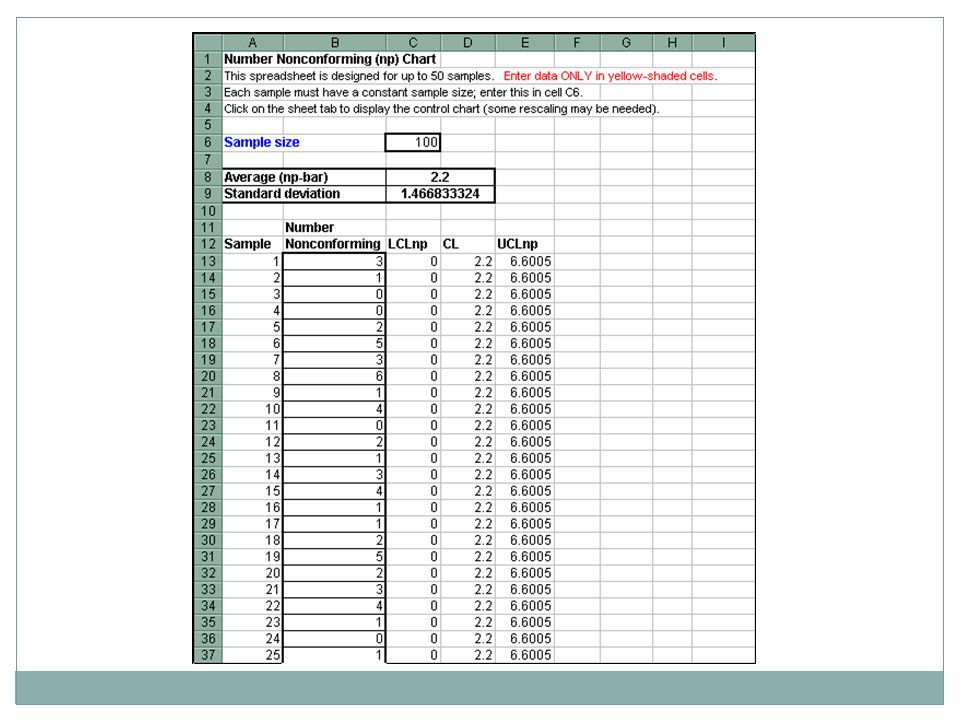
Note: If computed LCL is negative, set LCL = 0
np Chart assuming: np > 5 n(1-p) > 5 Note: If computed LCL is negative, set LCL = 0
 > 5. Note: If computed LCL is negative, set LCL = 0.")
61
c-chart dan u-chart Mengetahui banyaknya kesalahan unit produk sbg sampel Sampel konstan c-chart Sampel bervariasi u-chart Aplikasi : bercak pd tembok, gelembung udara pd gelas, kesalahan pemasangan sekrup pd mobil

62
C - chart Number of defects per unit: c¯ = ∑ ci / n

63
U-chart u¯ = ∑ ci/n n ¯ = ∑ ni/g g = banyaknya observasi
Model Individu BPA-u = u¯ + 3 √ (u¯ /ni) BPB-u = u¯ √ (u¯ /ni) Model Rata-rata BPA-u = u¯ + 3 √ (u¯ /n¯) BPB-u = u¯ √ (u¯ /n¯)
 BPB-u = u¯ - 3 √ (u¯ /ni) Model Rata-rata. BPA-u = u¯ + 3 √ (u¯ /n¯) BPB-u = u¯ - 3 √ (u¯ /n¯)")
64
Warning Conditions….. Western Electric :
titik diluar batas kendali ( 3σ) dr 3 titik berurutan diluar batas kend64li (2σ) dr 5 titik berurutan jauh dari GT (1σ) titik berurutan di satu sisi GT 5. Giliran panjang 7-8 titik /beberapa titik dekat satu batas kendali 7. Pola data TAK RANDOM
 2. 2 dr 3 titik berurutan diluar batas kend64li (2σ) 3. 4 dr 5 titik berurutan jauh dari GT (1σ) 4. 8 titik berurutan di satu sisi GT. 5. Giliran panjang 7-8 titik. 6. 1/beberapa titik dekat satu batas kendali. 7. Pola data TAK RANDOM.")
65
Patterns to Look for in Control Charts
Ask the students to imagine a product, and consider what problem might cause each of the graph configurations illustrated.

66
Example………p-np chart Twenty samples, each consisting of
250 checks, The number of defective checks found in the 20 samples are listed below. (proporsi tidak diketahui) $ 2655 Simon Says Augusta, ME 01227
 $ Simon Says. Augusta, ME")
67
Control Limits For a p Chart
$ 2655 Augusta, ME 01227 Simon Says Estimated p = 80/((20)(250)) = 80/5000 = .016 Note that the computed LCL is negative.
(250)) = 80/5000 = Note that the. computed LCL. is negative.")
68
Tdk sesuai Proporsi 4 1 5 3 2 7 (4/250) = 0,016 (1/250) =0,004 8 6 (2/250) = 0,008 (8/250) = 0,032
 = 0,016 (1/250) =0, (2/250) = 0,008 (8/250) = 0,032")
69
Control Limits For a p Chart
$ 2655 Augusta, ME 01227 Simon Says p Chart for Norwest Bank 0.000 0.005 0.010 0.015 0.020 0.025 0.030 0.035 0.040 0.045 UCL Sample Proportion p LCL 5 10 15 20 Sample Number

70
Ukuran sampel sama = 50 ( p-chart)
no Banyak produk cacat 1 2 3 4 5 6 7 8 9 10 11 12 13 14 15 16 17 18 19 20

71
n = m = D = p¯ = BKA = BKB = Tabel proporsi untuk plot ke grafik

72
n = 50 m = 20 D = 72 p¯ = 72 / (20.50) = .072 p = √ (0,072)(0,928)/50 = .037 BKA = 0, (0,037) = 0,183 BKB = 0, (0,037) = -0,039 = 0 Tabel proporsi untuk plot ke grafik
 = -0,039 = 0. Tabel proporsi untuk plot ke grafik.")
73
Ukuran sampel sama = 50 ( p-chart)
cacat proporsi 4 2 5 3 1 (4/50 ) = 0,08 (2/50) = 0,04 10 (5/50) = 0,01 (10/50) = 0,20 (out) revisi (4/50) = 0,08 (3/50) = 0,06
 = 0,08. (2/50) = 0, (5/50) = 0,01. (10/50) = 0,20 (out) revisi. (4/50) = 0,08. (3/50) = 0,06.")
74
Revisi p¯ = (72-10) / ( ) = 62/950 = 0,065 p = √ (0,065)(0,935)/50 = 0,035 BKA = 0, (0,035) = 0.17 BKB = 0, (0,035) = -0,04 = 0 Grafiknya juga berubah
 = -0,04 = 0. Grafiknya juga berubah.")
75
Ukuran sampel beda (p chart)
no sampel Produk cacat 1 2 3 4 5 6 7 8 9 10 200 180 120 300 250 400 210 380 14 17 20 18 25 30 15 11 12 13 16 19 190 390 26 24 Jml 4860 Cacat 341

76
Metode Rata-rata Sampel rata-rata n¯ = total sampel /observasi
= 4860/20 = 243 p¯ = D/(n¯m) = 341 / (243.20) = 0,07 (CL) p = √ (0,07(0,93))/ = 0,0164 BPAp = 0, (0,0164) = 0,119 BPBp = 0, (0,0164) = 0,021
 = 341 / (243.20) = 0,07 (CL) p = √ (0,07(0,93))/243 = 0,0164. BPAp = 0, (0,0164) = 0,119. BPBp = 0, (0,0164) = 0,021.")
77
Metode Individu Sampel rata-rata n¯ = total sampel /observasi
= 4860/20 = 243 p ¯ = D/(n¯m) = 341 / (243.20) = 0,07 (CL) semua titik sama BP (obs-1) p = √ (0,07(0,93))/200 = 0,018 BPA = 0, (0,018) = 0,124 BPB = 0, (0,018) = 0,016……………….dst
 = 341 / (243.20) = 0,07 (CL) semua titik sama. BP (obs-1) p = √ (0,07(0,93))/200 = 0,018. BPA = 0, (0,018) = 0,124. BPB = 0, (0,018) = 0,016……………….dst.")
78
Tabel Proporsi untuk Grafik
No observasi sampel cacat proporsi 1 2 3 4 5 6 7 8 9 10 11 12 13 14 15 16 17 18 19 20 200 180 120 300 250 400 210 380 190 390 25 30 26 24 0,070 0,055 0,085 0,067 … 0,095 0,050

79
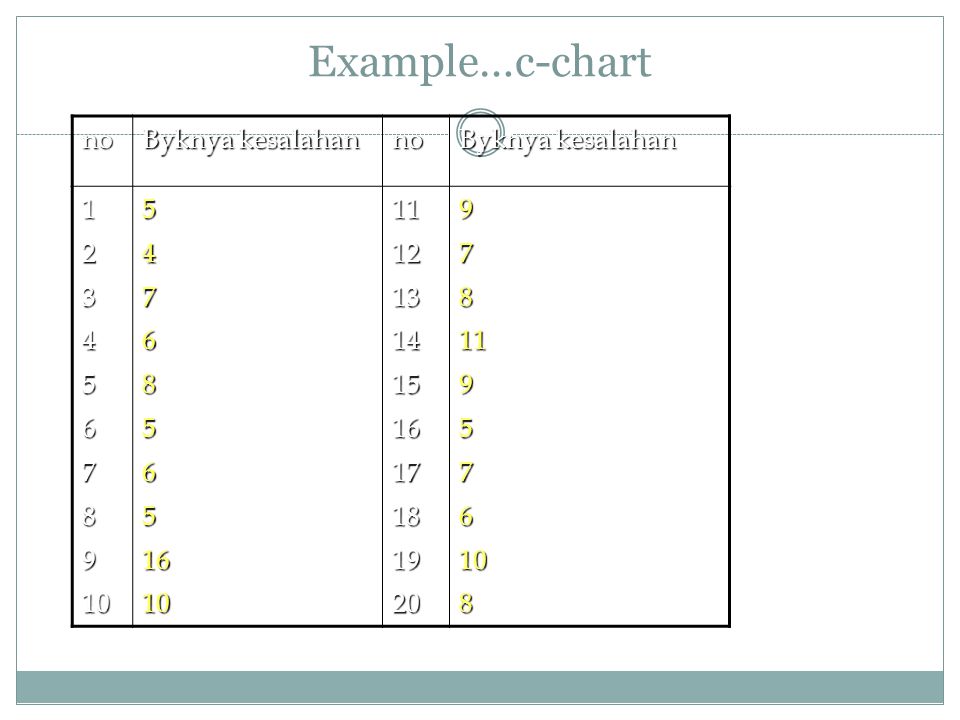
Example…c-chart no Byknya kesalahan 1 2 3 4 5 6 7 8 9 10 16 11 12 13
14 15 17 18 19 20
80
c¯ = ∑c/n = 152/20 = 7,6 BPA c = (7, 6) + 3 (√7,6) = 15,87 BPB c = (7, 6) - 3 (√7,6) = -0,67 = 0
 - 3 (√7,6) = -0,67 = 0.")
81
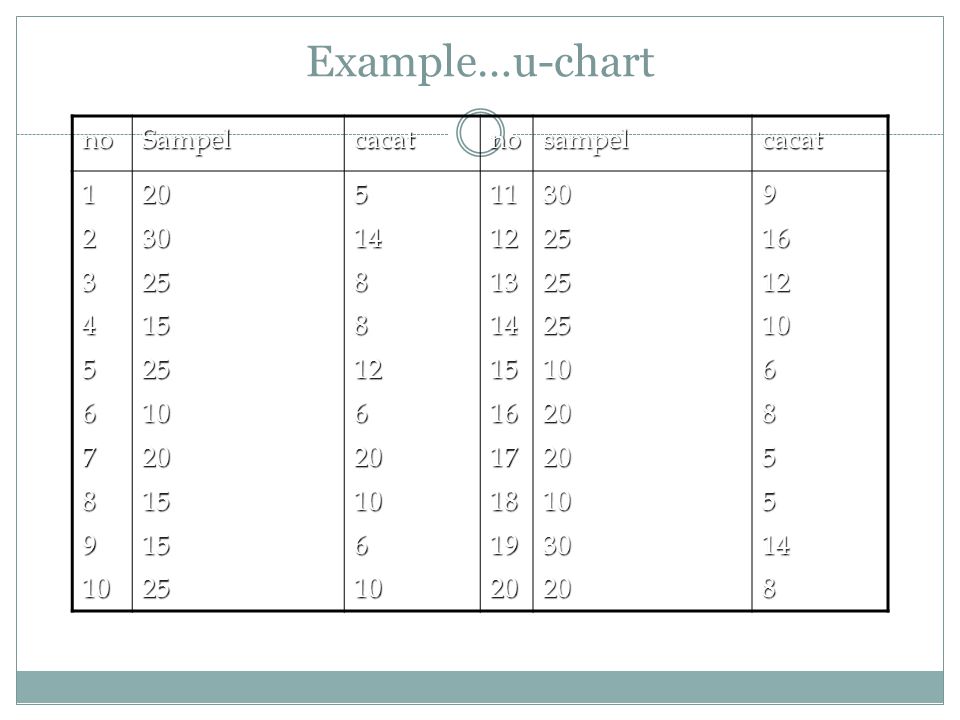
Example…u-chart no Sampel cacat sampel 1 2 3 4 5 6 7 8 9 10 20 30 25
15 14 12 11 13 16 17 18 19
82
Metode Rata-rata Sampel Rata-rata u¯ = 192/415 = 0,462 (CL)
n¯ = 415/20 = 20,75 BPAu = (0,462) + 3 √ (0,462/20,75) = 0,906 BPBu = (0,462) - 3 √ (0,462/20,75) = 0,018
 + 3 √ (0,462/20,75) = 0,906. BPBu = (0,462) - 3 √ (0,462/20,75) = 0,018.")
83
Metode Individu Sampel Rata-rata u¯ = 192/415 = 0,462 (CL)
Batas Kendali Observasi -1 BPA-1 = (0,462) + 3 √ (0,462/20) = 0,916 BPB-1 = (0,462) - 3 √ (0,462/20) = 0,008…….dst
 + 3 √ (0,462/20) = 0,916. BPB-1 = (0,462) - 3 √ (0,462/20) = 0,008…….dst.")
Presentasi serupa


>")


>")
>")
>")


 that are of interest to the researcher. Simbol.>")
>")
