Upload presentasi
Presentasi sedang didownload. Silahkan tunggu

1
14-16 September 2012 Villa Laguna, Cisarua-Bogor
AAPG SC UI, UNPAD DAN TRISAKTI The Emphasis of Empowering Geological and Geophysical Abilities To Bring Out Qualified Indonesian Geoscientist MASA DEPAN HIDROKARBON NON-KONVENSIONAL DI INDONESIA: KESEMPATAN DAN TANTANGAN AGUS GUNTORO Program Studi Tehnik Geologi, Fakultas Teknologi Kebumian dan Energi Universitas Trisakti 14-16 September 2012 Villa Laguna, Cisarua-Bogor

2
DAFTAR BAHASAN I. PENDAHULUAN II. ENERGI ALTERNATIF
III. PENDEFINISIAN & TEORI DASAR IV. SEJARAH PENGEMBANGAN V. S.W.O.T ANALYSES VI. HAMBATAN-HAMBATAN VII. KESIMPULAN

3
I. PENDAHULUAN PERUBAHAN STATUS DARI EXPORTIR MIGAS MENJADI NET IMPORTIR MIGAS Tahun 1982, KEBIJAKAN ENERGI NASIONAL (KEN), DENGAN 5 (lima) kebijakan strategis, yaitu; Intensifikasi, Diversifikasi, Konservasi, Indeksasi dan harga Energi. Tahun 2003, KEBIJAKAN ENERGI NASIONAL (KEN) TAHUN 2003 – 2020, untuk menciptakan keamanan pasokan energi (Energy Security Supply) nasional secara berkelanjutan dan pemanfaatan energi secara effisien FAKTA SAAT INI KITA SANGAT KEKURANGAN MINYAK DAN GAS BUMI dan terjadinya krisis energi KRISIS MULTI DIMENSI Atas dasar itu pengembangan energi alternatif menjadi sebuah solusi untuk mencapai kemandirian energI di tanah air, DAN SEKALIGUS KELUAR DARI MULTI DIMENSI KRISIS
, DENGAN 5 (lima) kebijakan strategis, yaitu; Intensifikasi, Diversifikasi, Konservasi, Indeksasi dan harga Energi. Tahun 2003, KEBIJAKAN ENERGI NASIONAL (KEN) TAHUN 2003 – 2020, untuk menciptakan keamanan pasokan energi (Energy Security Supply) nasional secara berkelanjutan dan pemanfaatan energi secara effisien. FAKTA SAAT INI KITA SANGAT KEKURANGAN MINYAK DAN GAS BUMI dan terjadinya krisis energi KRISIS MULTI DIMENSI. Atas dasar itu pengembangan energi alternatif menjadi sebuah solusi untuk mencapai kemandirian energI di tanah air, DAN SEKALIGUS KELUAR DARI MULTI DIMENSI KRISIS.")
4
Sumber: Googles KURVA PEAK OIL PRODUCTION DI DUNIA YANG SUDAH MENURUN

5
Sumber: Total Seminar 2010 ONGKOS PRODUKSI PER BARREL MINYAK DALAM BERBAGAI KONDISI

6
World energy outlook PERTUMBUHAN PERMINTAAN ENERGI GLOBAL
Sumber: Total Seminar 2010 PERTUMBUHAN PERMINTAAN ENERGI GLOBAL

7
APA ARTINYA ???

8
II. ENERGI ALTERNATIF KEBIJAKAN ENERGI NASIONAL (KEN)TAHUN 2003 – 2020, pemerintah berupaya keras mencari sumber daya energi alternatif Isu-isu global terhadap masalah lingkungan dan pemanasan global menyebabkan pemerintah mengarahkan pengembangkan kebijakan energi baru yang ramah lingkungan tetapi juga berbiaya murah sehingga dapat menjadi solusi pemenuhan kebutuhan energi dalam negri. Berbabagi riset energi alternatif terjadi diberbagai belahan dunia, misalnya: energi Geothermal, Biogas, Solar, Angin, Etanol, Nuklir, Hydrate Gas, Coal Bed Methane (CBM) dan Shale Gas. .
 dan Shale Gas. .")
9
ENERGI FOSSIL MEWAKILI 75% DARI SUPLAI ENERGI DUNIA DI TAHUN 2030

10
WORLD’S NEW ALTERNATIVE ENERGY ???

11
WORLD’S FUTURE ENERGY Clean burning- fuel Cheaper energy source
Reducing global warming Friendly environment

12
ENERGY ALTERNATIF FOR INDONESIA
Energi alternatif Gas Metana batubara dan Gas Serpih (Shale Gas) menjadi pilihan; 1. Jumlah cadangan yang besar di Indonesia, dan 2. Ramah lingkungan. Dari hasil studi pendahuluan yang dilakukan oleh berbagai institusi menyatakan potensi cadangan hipotesis CBM di Indonesia adalah 450 TCF dan Cadangan hipotesis Shale Gas sekitar 1000 TCF.
 menjadi pilihan; 1. Jumlah cadangan yang besar di Indonesia, dan 2. Ramah lingkungan. Dari hasil studi pendahuluan yang dilakukan oleh berbagai institusi menyatakan potensi cadangan hipotesis CBM di Indonesia adalah 450 TCF dan Cadangan hipotesis Shale Gas sekitar 1000 TCF.")
13
TARGET ENERGI MIX NASIONAL TAHUN 2025
Fossil Fossil Energies represent 95% Fossil Energies represent 83 % TARGET ENERGI MIX NASIONAL TAHUN 2025

14
SUMBERDAYA HIDROKARBON YANG MASIH HARUS DIHASILKAN DI MASA DEPAN

15
Global CBM Original Gas in Place >10,000 TCF
San Juan Raton, Powder BC Mexico Colombia Chile UK France Poland Ukraine Botswana S. Africa Russia India Indonesia China Viet Nam Australia CBM

16
NEGARA-NEGARA YANG AKTIF DALAM PENGEMBANGAN CBM

17
POTENSI CBM DI INDONESIA
Sumber: Presentasi Dirjen Migas, 25 Juni 2008

18
Global Gas Shale Plays GLOBAL SHALES EUROPE Review Completed 2009
c.40 wells to be completed 2010 c.30 additional wells -2010/11 N. AMERICA 200+Cored Wells CHINA Review due 2010/11 BRAZIL Solimoes Basin – Well Data 2010/11 TURKEY Review completed 2010 S E Anatolia Basin Well Data due end 2010 URUGUAY Well Data 2010/11 S AMERICA Review completed 2010 Geochemical Data end 2010 S AFRICA Review due early 2011 AUSTRALIA Review due late 2010 ARGENTINA Neuquen San Jorge Magallanes Well Data 2010/11

20
Huge shale potential in Indonesia
Large Shale Basins, with ~5,000 TCF GIP North Sumatra Shale Gas—338 Tcf East Kalimantan Shale Gas—1,723 Tcf CBM—496 Tcf Central Sumatra Shale Gas—558 Tcf CBM—165 Tcf South Sumatra Shale Gas—964 Tcf CBM—375 Tcf West Papua Shale Gas—648 Tcf Talisman asset Shale gas play CBM play West & East Java Shale Gas—722 Tcf CBM—56 Tcf Source: Talisman 2012 Source: Modified from IHS CERA

21
DEFINISI III. PENDEFINISIAN HIDROKARBON NON KONVENSIONAL
Hidrokarbon Non Konvensional didefinisikan sebagai MINYAK DAN GAS yang dihasilkan langsung dari tempat dimana minyak dan gas terbentuk dan belum mengalami migrasi ke tempat lain, baik di dalam batubara (CBM) ataupun di dalam Shale (SG) Terbentuknya hidrokarbon yang umumnya pada batuan yang berbutir sangat halus sehingga praktis tidak memiliki porositas dan permeabilitas yang signifikan. Oleh karena itu untuk memproduksikannya memerlukan perekahan dan pemboran secara horisontal
 ataupun di dalam Shale (SG) Terbentuknya hidrokarbon yang umumnya pada batuan yang berbutir sangat halus sehingga praktis tidak memiliki porositas dan permeabilitas yang signifikan. Oleh karena itu untuk memproduksikannya memerlukan perekahan dan pemboran secara horisontal.")
22
KONVENSIONAL DAN NON KONVENSIONAL HIDROKARBON SYSTEM
STRATA POTENSI ENERGI DI BAWAH PERMUKAAN BUMI YANG MEMBERIKAN PELUANG BAGI TERSEDIANYA ENERGI HIDROKARBON

23
COAL BED METHANE (CBM)
")
24
Why CBM being the world’s next alternative energy ?
GLOBAL OVERVIEW OF CBM Why CBM being the world’s next alternative energy ? 1 Provide a clean-burning fuel. 2 Increase substantially the natural gas reserve base 3 Improve safety of coal mining. 4 Decrease methane vented to the atmosphere from coal mines that might affect global warming. 5 Provide a means to use an abundant coal resource that is often too deep to mine Halliburton (CBM principles and practices)
")
25
What is Coal Bed Methane ?
The primary energy source of natural gas called METHANE (CH4). Coal bed methane (CBM) is simply methane found in COAL seams. It is produced by non-traditional means, and therefore, while it is sold and used the same as traditional natural gas, its production is very different. CBM is generated either from a biological process as a result of microbial action or from a thermal process as a result of increasing heat with depth of the coal. Often a coal seam is saturated with water, with methane is held in the coal by water pressure. Coal Seam Kristin Keith and Jim Bauder, Montana State University-Bozeman John Wheaton, Montana Bureau of Mines and Geology (2003)
. Coal bed methane (CBM) is simply methane found in COAL seams. It is produced by non-traditional means, and therefore, while it is sold and used the same as traditional natural gas, its production is very different. CBM is generated either from a biological process as a result of microbial action or from a thermal process as a result of increasing heat with depth of the coal. Often a coal seam is saturated with water, with methane is held in the coal by water pressure. Coal Seam. Kristin Keith and Jim Bauder, Montana State University-Bozeman John Wheaton, Montana Bureau of Mines and Geology (2003)")
26
April 20, 2017 | ©2007 Institut Teknologi Bandung |

27
ORIGIN AND CHARACTERISTICS OF CBM
What is Coalbed Methane? Natural gas produced from coal seams Sweet gas, generally greater than 90% methane, with small amounts of carbon dioxide and nitrogen Depressuring of reservoir typically required to allow desorption of gas to occur Gas production usually is at a low rate and low pressure Each basin containing CBM is unique in terms of geology, topography, water saturation, water chemistry Stage 1 Stage 2 Stage 3 Sandstone Coal Limestone

28
COALIFICATION PROCESS
CBM IN COAL SEAM Coal is formed in complicated process and needs long period (dozens and hundreds years) below the influence of physics, chemistry, and geological condition.
 below the influence of physics, chemistry, and geological condition.")
29
April 20, 2017 | ©2007 Institut Teknologi Bandung |

30
COAL RANK AND CLEAT AS CBM PARAMETER
Gas in coal can be derived from thermogenic or biogenic activity Biogenic can form early or late early at the beginning of coalification late by bacterial action in the reservoir Dominant gas generally thermogenic volume of gas increases with coalification (coal maturity) very large volumes of gas generated during coalification
 very large volumes of gas generated during coalification.")
31
Where is CBM found?

32
COAL CHARACTERISTIC FOR CBM POTENTIAL
Source : after Stevens and Sani, 2002

33
COAL CHARACTERISTIC FOR CBM POTENTIAL

34
GLOBAL CBM ORIGINAL GAS IN PLACE >10,000 TCF
GLOBAL OVERVIEW OF CBM GLOBAL CBM ORIGINAL GAS IN PLACE >10,000 TCF San Juan Raton, Powder BC Mexico Colombia Chile UK France Poland Ukraine Botswana S. Africa Russia India Indonesia China Viet Nam Australia CBM

35
POTENSI CBM DI INDONESIA
Sumber: Presentasi Dirjen Migas, 25 Juni 2008

36
COAL BED METHANE IN INDONESIA
INDONESIA CBM POTENTIAL IS SIMPLY INDICATED BY THE DISTRIBUTION OF COAL MINES

37
COAL BED METHANE IN INDONESIA
INDONESIA CBM POTENTIAL IS SIMPLY INDICATED BY THE DISTRIBUTION OF COAL MINES SAAT INI DALAM WAKTU 5 TAHUN SUDAH TERDAPAT SEKITAR 50 PSC UNTUK CBM DAN AKAN DITANDATANGANI SEKITAR 8 PSC TAHUN INI

38
Indonesia: Gas Content vs. Thickness
41 Bcf/mi2 600 San Juan Fairway Uinta-1 San Juan 500 Warrior Piceance 400 Gas Content (ft3/t) d.a.f. Raton 300 Uinta-2 WCSB- Plains Mannville I N D O N E S I A 200 W. Canada-Ardley Powder River 100 10 20 30 40 50 60 70 80 90 100 110 120 130 140 150 Completable Coal Thickness (ft) Advanced Resources International, Inc.
 d.a.f. Raton Uinta-2. WCSB- Plains. Mannville. I N D O N E S I A W. Canada-Ardley. Powder. River Completable Coal Thickness (ft) Advanced Resources International, Inc.")
39
Indonesia: Rank vs. Depth
Powder River 500 Black Warrior 1000 WCSB- SE B.C 1500 Raton 2000 WCSB- Ardley Uinta 2500 Depth (ft) Indonesia 3000 San Juan 3500 4000 4500 WCSB- Mannville 5000 5500 6000 0.3 0.5 0.7 0.9 1.1 1.3 1.5 Coal Rank (Ro) Advanced Resources International, Inc.
 Indonesia San Juan WCSB- Mannville Coal Rank (Ro) Advanced Resources International, Inc.")
40
SHALE GAS

41
Gas Shale & Shale Gas Shale is a sedimentary rock that was once deposited as mud (clay and silt) and is generally a combination of clay, silica (e.g. quartz), carbonate (calcite or dolomite), and organic material. While shales are generally thought of as being clay rich, the proportions of the constituents can be quite variable. Shale may also have thin beds or laminae of sandstone, limestone, or dolostone.
 and is generally a combination of clay, silica (e.g. quartz), carbonate (calcite or dolomite), and organic material. While shales are generally thought of as being clay rich, the proportions of the constituents can be quite variable. Shale may also have thin beds or laminae of sandstone, limestone, or dolostone.")
42
WHAT IS SHALE GAS Shale gas is natural gas produced from shale. Gas shales are thought of dually system as hydrocarbon source rocks and fine-grained tight-gas reservoirs. Shale gas refers to in situ hydrocarbon gas present in organic rich, fine grained, sedimentary rocks (shale and associated lithofacies). Gas is generated and stored in situ in gas shales as both sorbed gas (on organic matter) and free gas (in fractures or pores). As such, gas shales are self-sourced reservoirs. Low-permeable shales require extensive fractures (natural or induced) to produce commercial quantities of gas.
. Gas is generated and stored in situ in gas shales as both sorbed gas (on organic matter) and free gas (in fractures or pores). As such, gas shales are self-sourced reservoirs. Low-permeable shales require extensive fractures (natural or induced) to produce commercial quantities of gas.")
43
Where is Shale Gas Found ?
Shale gas is found in shale "plays," which are shale formations containing significant accumulations of natural gas and which share similar geologic and geographic properties. A shale gas system is a self-contained source reservoir system. In this system, shales that generated the gas also function as low matrix permeability and low porosity reservoir rocks.

44
Sample of shale from Utica Shale
near town of Donnaconna, Quebec Dark beds are shale, light beds are limestone. Part of the dark colour in the Utica Shale comes from organic matter. A writing pen is shown for scale.

45
DIAGRAM OF SOURCE ROCK MATURITY
Diagram of source rock maturity in order to generate hydrocarbon by increasing depth and temperature Claypool (1998) separated shale gas systems by gas type: Biogenic Gas, Thermogenic Gas, Mixed Gas. Dan Jarvie et al. (2007) classified the shale gas systems into several types: 1. High-thermal maturity shales (e.g. Barnett Shale). 2. Low-thermal maturity shales (e.g. New Albany Shale). 3. Mixed lithology intraformational systems (e.g. Bossier Shale of East Texas). 4. Combination plays that have both conventional and unconventional gas production (e.g. in Woodford shale gas and conventional gas accumulation in Anadarko Basin).
 separated shale gas systems by gas type: Biogenic Gas, Thermogenic Gas, Mixed Gas. Dan Jarvie et al. (2007) classified the shale gas systems into several types: 1. High-thermal maturity shales (e.g. Barnett Shale). 2. Low-thermal maturity shales (e.g. New Albany Shale). 3. Mixed lithology intraformational systems (e.g. Bossier Shale of East Texas). 4. Combination plays that have both conventional and unconventional gas production (e.g. in Woodford shale gas and conventional gas accumulation in Anadarko Basin).")
46
Shale Gas In-place Calculations
“..not taken up..”

47
Schematic Of Oil & Gas Generation
Why is there more gas at higher thermal maturity? S H A L E G

48
COMMON CHARACTERISTICS AMONG GAS SHALES
•High Gamma Ray •High Resistivity •High organic content (>1%) •High maturity (late oil window or higher) •Brittleness (>40% Qz. content) •Thickness (> 30 ft) •Porosity (>4%) •Deposited in marine environments •Type II kerogen •Presence of fracture barriers (usually carbonates) Low permeability (in nano darcy scale) LIST OF CONTENT
 •High maturity (late oil window or higher) •Brittleness (>40% Qz. content) •Thickness (> 30 ft) •Porosity (>4%) •Deposited in marine environments. •Type II kerogen. •Presence of fracture barriers (usually carbonates) Low permeability (in nano darcy scale) LIST OF CONTENT.")
49
PETROPHYSIC RESULT EMAS-1

50
TOC Typical Gas Prospects
RANGES OF TOTAL ORGANIC CARBON IN TYPICAL TIGHT GAS SAND, SHALE GAS, AND COAL BED METHANE PROSPECTS

51
How Is Shale Gas Produced?
Two major drilling techniques are used to produce shale gas : Horizontal drilling : is used to provide greater access to the gas trapped deep in the producing formation. First, a vertical well is drilled to the targeted rock formation. At the desired depth, the drill bit is turned to bore a well that stretches through the reservoir horizontally, exposing the well to more of the producing shale. Hydraulic fracturing (commonly called “fracking” or “hydrofracking”) : is a technique in which water, chemicals, and sand are pumped into the well to unlock the hydrocarbons trapped in shale formations by opening cracks (fractures) in the rock and allowing natural gas to flow from the shale into the well. Diagram of a Typical Hydraulic Fracturing Operation
 : is a. technique in which water, chemicals, and sand are pumped into the well to unlock the hydrocarbons trapped in shale formations by opening cracks (fractures) in the rock and allowing natural gas to flow from the shale into the well. Diagram of a Typical Hydraulic Fracturing Operation.")
52
PERBEDAAN PRODUKSI GAS KONVENSIONAL DAN NON KONVENSIONAL
Conventional reservoir production generally achieves peak rate at onset with continuous decline and shorter production life NGC reservoirs usually require early production de- watering to lower pressure. Production volumes peak after de-watering becomes effective and production declines over a longer time period

53
Single Well Profile - West Sanga Sanga Area Sweet Spot-1

54
Gas Production Profile Of Bampo Formation
CASE # 1 Scenario Horizontal Length, ft K Matrix, md Porosity, % Fracture-Matrix Permeability Ratio Well Spacing Acre Fracture Spacing, ft Case -3 2000 7.8 100000 560 400 Qi = Mscfd Qavr = Mscfd = Mscfd

55
Total PRODUCTION of shale gas field (CASE # 1)
Year 5 6 7 8 9 10 11 12 13 14 15 16 17 18 19 20 21 Total Number of Well Bampo 23 35 33 32 30 28 26 24 22 Baong Sum 46 43 41 39 36 31 27 25 522

56
Distribution of Development Wells of CBM BLOCK
Base Case Scenario (160 acres, 5 mD)
")
57
UNCONVENTIONAL GAS VS CONVENTIONAL GAS ???

58
IV. SEJARAH PENGEMBANGAN
Coal Bed Methane dan Shale Gas dikembangkan relatif hampir bersamaan yaitu disekitar awal 1980an, walau CBM lebih dahulu dikenal dan diproduksikan. Dari berbagai pemelajaran mengenai sejarah pengembangan ternyata membutuhkan setidaknya 15 – 20 tahun dari mulai proses eksplorasi hingga produksi. Ada banyak kegagalan sebelum Amerika Serikat, Canada, China dan India dapat berhasil pada daerah daerah tertentu di negara mereka saat ini. Artinya sekali lagi memberitahukan kepada kita kendatipun batubara untuk CBM tersedia dan Serpih untuk Shale Gas juga ada, tetapi tidak menjamin untuk dapat diproduksikan secara komersil. Hal ini harus menjadi sebuah masukkan bagi kebijakan yang akan dikembangkan oleh

59
GLOBAL OVERVIEW OF CBM Scientific understanding of, and production experience with, coal-bed methane are both in the early learning stages. “Much is yet to be learned” 1 about the controls on the occurrence and recoverability of coal-bed methane—the geologic, geochemical, engineering, technological, and economic factors, for example 2 about the environmental implications of developing the resource USGS (Science for Changing World), 2000
,")
60
CBM Indonesia Growth Benchmarking
This Graph represents a benchmarking of the CBM activity and CBM gas production growth from different CBM leading nations around the globe. The graphs are normalized and all the curves are presented from year one onward USA experienced very aggressive CBM production ramp up after the tax incentive introduced in 1980 and taking advantage of the gas price boom after 1990. Canada achieved outstanding growth despite the low quality of the CBM play. Leveraging of the long experience from the shallow gas business Canada achieved full scale production only ion 5 years after initial CBM wells were drilled. Australia took longer to ramp up their CBM production, the main reason is the very limited local gas market. Once the LNG idea flourished, many big players are in the CBM development now with 2 CSG to LNG projects approved “ Final Investment Decisions” annouced by BG/QGC and Santos/Petronas/Total earlier this year. Source; Sammy Hamzah 2011

61
30 Year History of CBM in United States
500 1,000 1,500 2,000 2,500 3,000 3,500 4,000 4,500 5,000 1/1/86 1/1/90 1/1/94 1/1/98 1/1/02 1/1/06 MMCFD All US CBM (EIA) Sum: SJB, PRB, Raton Basin San Juan Basin Powder River Basin Raton Basin Drill 1,081 s-shaped wells from existing well pads Install 100+ miles of new gathering lines Install over 100,000 hp of additional compression Expand midstream capacity from 650 to 730 mmscfd (Florida River Gas Plant from 420 to 500 mmscfd and utilizing 230 mmscfd of capacity in the Red Cedar System) Install 8 new compressor stations Add wellhead compression near the end of the project to enable reserve recovery and to mitigate rate decline
 Sum: SJB, PRB, Raton Basin. San Juan Basin. Powder River Basin. Raton Basin. Drill 1,081 s-shaped wells from existing well pads. Install 100+ miles of new gathering lines. Install over 100,000 hp of additional compression. Expand midstream capacity from 650 to 730 mmscfd (Florida River Gas Plant from 420 to 500 mmscfd and utilizing 230 mmscfd of capacity in the Red Cedar System) Install 8 new compressor stations. Add wellhead compression near the end of the project to enable reserve recovery and to mitigate rate decline.")
62
Stages of Exploration and Development
1 2 3 4 5 20 Time (years) Stage 1: Identification of CBM Resource Government and Stakeholder Consultation occurs throughout all stages of exploration and development Stage 2: Early Evaluation Drilling Note: In some cases, government provides incentives to encourage industry investment and development of the resource. This usually occurs in the early stages (1 or 2) of the project Stage 3: Pilot Project Drilling Stage 4: Pilot Production Testing Stage 5: Commercial Development Go/No Go Decisions are made at the end of each stage dependent on the results of the geological and engineering information that has been collected Project Reclamation
 Stage 1: Identification of. CBM Resource. Government and Stakeholder Consultation. occurs throughout all stages of exploration. and development. Stage 2: Early Evaluation Drilling. Note: In some cases, government provides. incentives to encourage industry investment. and development of the resource. This usually. occurs in the early stages (1 or 2) of the project. Stage 3: Pilot Project Drilling. Stage 4: Pilot Production Testing. Stage 5: Commercial Development. Go/No Go Decisions are made at the end of each stage dependent on the results of the geological and engineering information that has been collected. Project. Reclamation.")
63
SUCCESSFUL SHALE GAS PLAYS
= 530 km² BASED ON PROVEN SHALE GAS PLAY IN USA

64
V. S.W.O.T ANALYSES STRENGTH:
Indonesia memiliki potensi sumberdaya hidrokarbon non konvensional yang sangat besar; Potensial CBM 450 TCF dan Potensial Shale Gas 1000 TCF Memiliki pengalaman dan peraturan perundangan di bidang konvensional yang sudah mapan sehingga dapat menjadi pembelajaran menuju ke non konvensional.

65
WEAKNESS Potensi CBM dan Shale Gas belum terbukti dapat diproduksikan secara komersil. Memerlukan lahan yang besar, sumur yang banyak dan capital yang besar Pemodelan simulasi reservoar memperlihatkan produksi yang sangat kecil per sumur Masalah tumpang tindih lahan Masalah peraturan yang terlalu birokrasi Infrastruktur yang masih belum memadai di wilayah-wilayah yang potensi terhadap keberadaan hidrokarbon non konvensional. Ini akan berdampak kepada high cost production.

66
OPPORTUNITY Adanya pasar, domestik dan internasional, karena adanya kebutuhan energi di masa depan yang dapat terpenuhi oleh non konvensional hidrocarbon Daya saing harga non konvensional yang kompetitif dalam jumlah besar Masuknya investasi asing

67
ANCAMAN Tumpang tindih lahan dari pertanian, perkebunan, pertambangan, konvensional dan non konvensional hidrokarbon yang akan menjadi sumber konflik dan terhambatnya eksplorasi dan produksi Peraturan perundangan yang birokrasi Sistim fiskal yang tidak menarik sehingga membuat investor tidak menaruh minat Terhambatnya penelitian di bidang non konvensional hidrokarbon

68
STRATEGI PENGEMBANGAN KE DEPAN
BERDASARKAN S.W.O.T ANALYSES INI MAKA STRATEGI PENGEMBANGAN DAPAT DIKOMBINASIKAN DALAM STRATEGI S/O; S/T, W/O, W/T

69
VI. HAMBATAN HAMBATAN Tumpang tindih lahan
Peraturan Menteri ESDM No. 33 Tahun 2006 dan revisinya No. 36 Tahun 2008, wilayah pengembangan GMB dan juga SG meliputi wilayah terbuka, wilayah PKP2B dan KP batubara serta WK Migas. Resiko tumpang tindih wilayah kerja tidak dapat dihindari. Resiko permukaan (surface): rusaknya fasilitas produksi minyak dan gas bumi. Resiko bawah permukaan (subsurface) akibat tumpang ada kemungkinan dihasilkan migas & GMB secara bersamaan, terutama pada reservoir yang relatif dangkal. Di samping itu, terdapat kendala administrasi pertanahan dan infrastruktur penunjang. Dalam pengembangan GMB, diperlukan relatif lebih banyak sumur. Oleh karena itu, pembebasan lahan, baik untuk lokasi sumur, akses jalan, maupun pembangunan fasilitas produksi, pada area tumpang tindih memiliki resiko yang cukup tinggi. Mitigasi kendala dan resiko tersebut diatas harus disiapkan sejak dini untuk mengantisipasi kegiatan operasional yang berjalan bersamaan. Apabila hal itu tidak dilakukan, maka hidrokarbon non konvensional tidak dapat berkembang sebagaimana mestinya.
: rusaknya fasilitas produksi minyak dan gas bumi. Resiko bawah permukaan (subsurface) akibat tumpang ada kemungkinan dihasilkan migas & GMB secara bersamaan, terutama pada reservoir yang relatif dangkal. Di samping itu, terdapat kendala administrasi pertanahan dan infrastruktur penunjang. Dalam pengembangan GMB, diperlukan relatif lebih banyak sumur. Oleh karena itu, pembebasan lahan, baik untuk lokasi sumur, akses jalan, maupun pembangunan fasilitas produksi, pada area tumpang tindih memiliki resiko yang cukup tinggi. Mitigasi kendala dan resiko tersebut diatas harus disiapkan sejak dini untuk mengantisipasi kegiatan operasional yang berjalan bersamaan. Apabila hal itu tidak dilakukan, maka hidrokarbon non konvensional tidak dapat berkembang sebagaimana mestinya.")
70
2. Kebijakan Alokasi Area Tambang Batubara.
Kebijakan Alokasi Area Tambang Batubara dapat dipisahkan berdasarkan metode tambang, mana yang lebih ekonomis dan ramah lingkungan antara pengusahaan tambang Terbuka dengan hidrokarbon non-konvensional. Untuk prospek GMB di Indonesia yang berkisar pada kedalaman 300 meter hingga 1000 meter, sebaiknya dapat dipilah area tambang batubatara mana yang di alokasikan untuk tambang terbuka ataukah untuk area lapangan pengembangan GMB. Adanya perbedaan kepentingan ini jika tidak terselesaikan akan menjadi hambatan yang paling serius, disamping itu juga tentunya memerlukan biaya yang sangat mahal.

71
3. Biaya eksplorasi hidrokarbon non konvensional relatif masih lebih tinggi dari yang rencanakan.
Kurang tersedianya data-data teknis yang berorientasi ekplorasi GMB disinyalir memegang peranan terhadap tingkat keberhasilan dalam tahap eksplorasi KKKS GMB dan SG melakukan proses akusisi data-data baru yang lebih berorientasi kepada GMB guna meningkatkan tingkat keberhasilan eksplorasi Ketersediaan, keterbatasan dan spesifikasi corehole dan sumur eksplorasi memiliki sumbangsih dalam meningkatnya biaya eksplorasi GMB. jenis alat kerja penunjang saat ini dapat juga memicu meningkatnya biaya pengadaan alat kerja pendukung. Ganti rugi lahan yang masih tinggi.dimana tidak semua daerah mau menerima harga yang normal (NJOP) untuk Penggantian lahan yang terpakai dalam proses eksplorasi Dewatering dan penanganan hasil dewatering merupakan salah satu fase yang juga dianggap dapat menaikkan biaya eskplorasi . Dibutuhkan biaya untuk mencapai standar baku mutu air (Kementrian Lingkungan Hidup) untuk air yang dihasilkan. Proses fracturing pada SG memerlukan jumlah air yang sangat besar sehingga dapat terjadi konflik kebutuhan air antara pertanian dan SG
 untuk Penggantian lahan yang terpakai dalam proses eksplorasi. Dewatering dan penanganan hasil dewatering merupakan salah satu fase yang juga dianggap dapat menaikkan biaya eskplorasi . Dibutuhkan biaya untuk mencapai standar baku mutu air (Kementrian Lingkungan Hidup) untuk air yang dihasilkan. Proses fracturing pada SG memerlukan jumlah air yang sangat besar sehingga dapat terjadi konflik kebutuhan air antara pertanian dan SG.")
72
4. Standarisasi Metodalogi Teknis Eksplorasi, Produksi dan Pengolahan hidrokarbon non konvensional
Petunjuk Teknis untuk Eksplorasi, Produksi dan Pengolahan GMB dianggap perlu disesuaikan dan distandarkan dengan kondisi geologis dan geografis di Indonesia sehingga dapat meningkatkan hasil dan menekan biaya eksplorasi.

73
5. Turunan atas Kebijakan Pemerintah dalam alokasi pengguna untuk pemanfaatan hasil GMB dan SG disertai standarisasi harga untuk setiap alokasi. alokasi hasil produksi GMB perlu dijelaskan detail orientasinya tiap daerah disertai dengan acuan harga GMB.

74
6. Kesinambungan dari kebijakan-kebijakan yang telah ada (Comprehensive & Coherent Policy).
Kesungguhan pemerintah Indonesia untuk mengembangkan sumber alternatif ini. GMB melalui Perpres No. 5 tahun 2006 dan bernaung di bawah UU Migas No. 22 tahun GMB ditargetkan akan menjadi penyumbang 3,3% dari konsumsi energi primer Indonesia tahun Permen No. 33 tahun 2006 yang disempurnakan menjadi Permen No. 36 tahun 2008. Pemerintah diminta harus lebih fokus dan diharapkan konsisten dalam menjalankan kebijakan secara berkesinambungan Sebagai referensi, Cina sebagai negara di Asia yang paling maju industri GMB-nya, telah mengukuhkan kebijakan pengembangan GMB lewat regulasi yang bernama the Law of Coal of the People’s Republic of China. Peran dan dukungan besar Pemerintah dimana setiap langkah kebijakannya selalu berorientasi pada penarikan minat investor dan memberikan hak yang lebih kepada para praktisi energy, baik dalam maupun luar negeri untuk mengeksploitasi sumber alternatif tadi. India juga mengokohkan regulasi GMB untuk memacu pengembangannya. Dengan beberapa tawaran kerjasama dalam kebijakan GMB-nya, seperti; tidak adanya bonus tanda tangan dan pembebasan bea-masuk terhadap alat-alat impor pengelolaan GMB, negeri India pun akhirnya berhasil menggeser sedikit demi sedikit ketergantungannya terhadap fosil karena telah tergantikan oleh sumber energi alternatif ini.

75
7. Mengkaji Penetapan Pajak dan bea masuk untuk sarana pendukung yang memberatkan Investor.
Penetapan pajak yang begitu banyak. Sebagaimana yang diisyaratkan pada pasal 31 ayat 1 dan 4 UU Migas, disebutkan bahwa para investor harus membayar pajak-pajak, bea masuk, dan pungutan lain atas impor dan cukai pada tahap eksplorasi. Hal ini tidak sejalan dengan biaya investasi GMB yang berslogan low cost, mengingat sumber energi ini masih terhitung sesuatu yang baru dan pengembangannya memiliki resiko yang sangat tinggi. Melihat strategisnya kendala dan resiko tersebut diatas, dipandang perlunya dibuat suatu peraturan perudang-undangan (Juklak Juknis), minimal setingkat peraturan menteri, untuk mengatur kemungkinan benturan kepentingan (conflict of interest) di tingkat operasional dalam pengusahaan minyak & gas bumi, GMB dan batubara guna menambah kepercayaan investor untuk terjun seperti apa yang telah dilakukan oleh negara Cina dan India.
, minimal setingkat peraturan menteri, untuk mengatur kemungkinan benturan kepentingan (conflict of interest) di tingkat operasional dalam pengusahaan minyak & gas bumi, GMB dan batubara guna menambah kepercayaan investor untuk terjun seperti apa yang telah dilakukan oleh negara Cina dan India.")
76
8. Fiscal term yang tidak attractive
Hasil dari perhitungn secara faktual memperlihatkan term dan condition yang ditawarkan boleh jadi menjadi tidak menarik. Secara faktual produksi unconvensioanl hidrocarbon ini sangatlah kecil, baik CBM dan Shale Gas, ditambah lagi dengan kondisi geologi terhadap kemenerusan batubara menjadikan perhitungan cadangan menjadi sangat terbatas. Kecilnya produksi per sumur dan banyaknya sumur yang harus di bor pada akhirnya memperlihatkan kepada kita begitu lamanya masa pengembalian modal (IRR). Oleh karena hidrokarbon non konvensional ini memerlukqn sebuah pendekatan yang berbeda terhadap konvensional yang sudah berjalan dengan baik.
. Oleh karena hidrokarbon non konvensional ini memerlukqn sebuah pendekatan yang berbeda terhadap konvensional yang sudah berjalan dengan baik.")
77
Coalbed Methane Development Costs
In Alberta, royalty rate is the highest portion of project costs over the life of the project. This is based upon the assumption that net well gas production rates reach a threshold of 500 mcf/day. If net well production Is lower, the royalty rate drops to between 5 and 15% In Alberta, the infrastructure for gas production to market is well established. In regions where no infrastructure exists government royalties may need to be lower to allow for investors to pay for the additional Infrastructure costs, or these costs may need to be born by the government Incentives may be required to attract foreign investment for CBM development due to risk of specific projects drilling stimulation gathering operating taxes compression reclamation land acquisition royalties return on capital 0.0 5.0 10.0 15.0 20.0 25.0 30.0 35.0 Project Elements Percent of $/mcf

78
MARGINAL UNCONVENSIONAL RATE OF RETURN
Unconventional gas is a marginal investment nearly everywhere Liquids content can make a play economic Incentives required to improve contractor returns Source: Wood Mackenzie

79
Existing terms are not conducive to shale development
Only a world class shale play will be attractive in Indonesia Play “A” is similar to some being pursued in Algeria and Canada Target total government take must be lower. Incentives are necessary. Plays Worse Better A (Barnett) B (Montney) C (Eagleford) 3.0 BCF, dry 6.0 BCF, dry 6.0 BCF, wet $28.1/BOE $14.5/BOE $9.6/BOE CBM terms (gross PSC, equiv to 65/35 split**) -0.5 0% 34% -0.1 7% 47% 0.6 26% 54% Traditional terms (PSC 65/35) -0.3 2% 26% 0.0 11% 45% 0.6 32% 57% Frontier terms (PSC 60/40) -0.3 2% 25% 0.0 11% 43% 0.7 34% 54% Tax only -0.3 4% 14% 0.3 17% 26% 1.3 47% 33% Profitability index Contractor IRR Total GoI take* Terms Play #1 is a Marcellus type curve – dry gas, 3.0 BCF/well (also similar to Poland and Algeria) Play #5 is a Montney type curve – dry gas, 6.0 BCF/well (better than the typical Montney) Play #6 is an Eagleford type curve – wet gas, 6.0 BCF/well (actually a very good sweet spot within the Eagleford) Better * GoI take is Indonesia revenue from all sources, including FTP, share of production, and taxes ** Equivalent to 65/35 PSC split implies cost assumption 30% of gross revenue (per MIGAS illustration of gross PSC terms) Source: Talisman 2012
 B (Montney) C (Eagleford) 3.0 BCF, dry. 6.0 BCF, dry. 6.0 BCF, wet. $28.1/BOE. $14.5/BOE. $9.6/BOE. CBM terms (gross PSC, equiv to 65/35 split**) % 34% % 47% % 54% Traditional terms (PSC 65/35) % 26% % 45% % 57% Frontier terms (PSC 60/40) % 25% % 43% % 54% Tax only % 14% % 26% % 33% Profitability index. Contractor IRR. Total GoI take* Terms. Play #1 is a Marcellus type curve – dry gas, 3.0 BCF/well (also similar to Poland and Algeria) Play #5 is a Montney type curve – dry gas, 6.0 BCF/well (better than the typical Montney) Play #6 is an Eagleford type curve – wet gas, 6.0 BCF/well (actually a very good sweet spot within the Eagleford) Better. * GoI take is Indonesia revenue from all sources, including FTP, share of production, and taxes. ** Equivalent to 65/35 PSC split implies cost assumption 30% of gross revenue (per MIGAS illustration of gross PSC terms) Source: Talisman")
80
International examples
There is no single right answer for how to improve contractor returns Different contract types can attract shale investment Government take must be driven by quality of the rocks and cost structure Poland Royalty/Tax Regime Taxes rate fixed at 19% Royalty is variable, established by a council for each case (~$0.05/mcf) Tax deductions: royalty, opex, cap. depreciation Gov’t take is ~20% Long-term contracts British Columbia Royalty/Tax Regime Tax rate is 25%, combined federal and provincial Royalty is variable, based on well characteristics (~18%) Incentives for marginal wells and deep targets Subsidies provided for required infrastructure development Seasonal royalty credits Production leases held as long as producing What is working elsewhere Types of terms that are encouraging investment Shouldn’t be a copy-paste to Indonesia Need to focus on cost of supply and be responsive Algeria Royalty/Tax Regime Tax rate 30% Additional profits tax of 15% Royalty is region-specific Wide sliding scale (6-23%) based on daily production Production licence lasts 32 years USA (Eagleford) Royalty/Tax Regime Tax rate ~39% (federal, state, and local) Long history of tax credits to encourage development Several lasting tax deductions Royalty rates negotiable with mineral owners Production leases as long as producing Source: Talisman 2012
 Tax deductions: royalty, opex, cap. depreciation. Gov’t take is ~20% Long-term contracts. British Columbia. Royalty/Tax Regime. Tax rate is 25%, combined federal and provincial. Royalty is variable, based on well characteristics (~18%) Incentives for marginal wells and deep targets. Subsidies provided for required infrastructure development. Seasonal royalty credits. Production leases held as long as producing. What is working elsewhere. Types of terms that are encouraging investment. Shouldn’t be a copy-paste to Indonesia. Need to focus on cost of supply and be responsive. Algeria. Royalty/Tax Regime. Tax rate 30% Additional profits tax of 15% Royalty is region-specific. Wide sliding scale (6-23%) based on daily production. Production licence lasts 32 years. USA (Eagleford) Royalty/Tax Regime. Tax rate ~39% (federal, state, and local) Long history of tax credits to encourage development. Several lasting tax deductions. Royalty rates negotiable with mineral owners. Production leases as long as producing. Source: Talisman")
81
IRR, NVP, POT, PI AS A FUNCTION OF Contractor Share Changes & gas price for north sumatera

82
KESIMPULAN Pengembangan CBM dan Shale Gas sudah terjadi di banyak negara di dunia dan adanya potensi pasar untuk kebutuhan gas alam. Diperkirakan sumberdaya CBM di Indonesia mencapai sekitar 450 TCF dan Shale Gas hingga 1000 TCF . Pengembangan CBM sudah mencapai tahap komersial di negara-negara seperti; USA, Canada, Australia, China dan India dengan mencapai total produksi sekitar ~6 Bcf per hari CBM dan Shale Gas sebagai sumber energi yang murah biayanya, dapat dipercaya dan mampu mensuplai gas alam dalam jangka waktu yang lama. Projek CBM dan Shale Gas sangat membutuhkan biaya yang besar dan membutuhkan waktu sekitar 5-10Th sebelum keberhasilan secara komersial dapat tercapai (Sebagai catatan: tidaklah semua projek CBM ini dapat berhasil, hal ini sangat tergantung dari kondisi geologi dan parameter dari batubara itu sendiri). Hidrokarbon (Gas) non konvensional yang secara lingkungan dapat lebih diterima dibandingkan dengan sumber energi hidrokarbon lainnya (batubara dan Minyak Bumi). Keberhasilan projek CBM dan Shale Gas dipengaruhi oleh beberapa faktor, yaitu; Kemampuan menghasilkan gas alam dalam tingkat yang ekonomis Kemampuan untuk mengontrol biaya ekplorasi dan pengembangan Adanya ketersediaan pasar baik dometik atau pun ekspor. Kemudahan pengembangan infrastruktur (baik yang sudah tersedia atau pun biaya yang rendah)
. Hidrokarbon (Gas) non konvensional yang secara lingkungan dapat lebih diterima dibandingkan dengan sumber energi hidrokarbon lainnya (batubara dan Minyak Bumi). Keberhasilan projek CBM dan Shale Gas dipengaruhi oleh beberapa faktor, yaitu; Kemampuan menghasilkan gas alam dalam tingkat yang ekonomis. Kemampuan untuk mengontrol biaya ekplorasi dan pengembangan. Adanya ketersediaan pasar baik dometik atau pun ekspor. Kemudahan pengembangan infrastruktur (baik yang sudah tersedia atau pun biaya yang rendah)")
83
REFERENCES Dawson, FM Energy Evolution: Alberta’s Role in Unconventional Gas in North America. Canadian Society for Unconventional Gas, September 2007 Walter, BA Jr, 2002: Coalbed Gas Systems, resources, and production and a review of contrasting cases from the San Juan and Powder Basins. AAPG Bulletin, V.86, No. 11, Nov 2002. TOTAL TEES SEMINAR, PRANCIS TALISMAN INTERNAL SEMINAR

84
Back-up slide

85
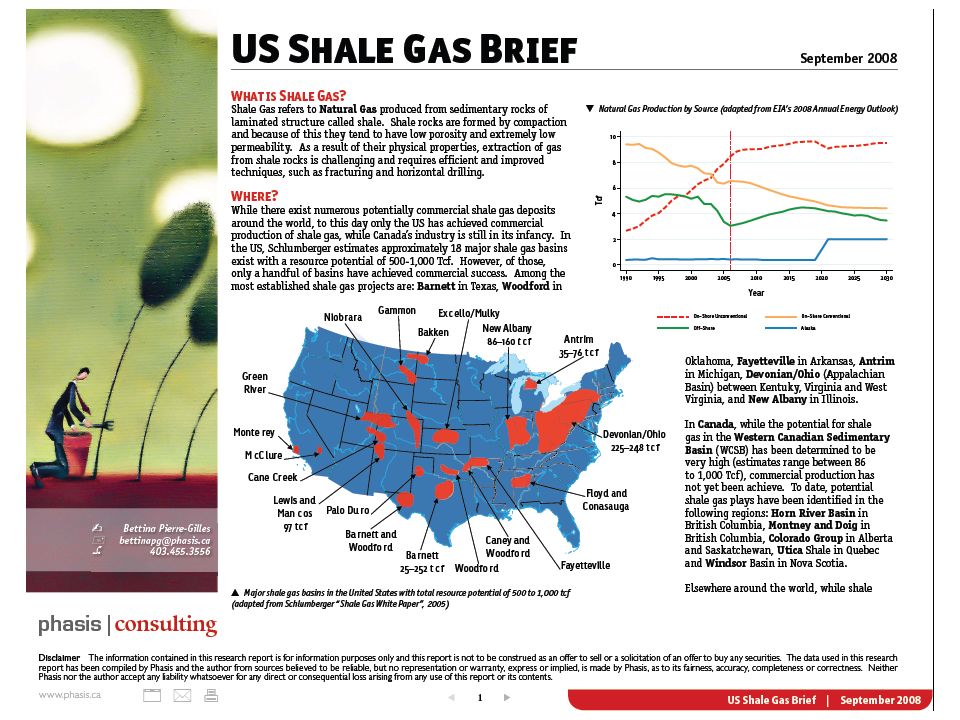
US SHALE GAS By the end of 2007 gas production from all unconventional reservoirs provided 48% of the total US gas production. Projections indicate that by 2020 they will be providing roughly 69% of the total production (Ref.2.). As indicated in Figure, the biggest contribution to this increase is expected to come from shale gas reservoirs.
. As indicated in Figure, the biggest contribution to this increase is expected to come from shale gas reservoirs.")
86
Coalbed Methane Development Costs
Relative Capital Costs for Development of a 40 Well CBM Field Stage Activity Cost - shallow % share Cost -deep 1 land acquisition $5,000,000 11 5.5 2 preliminary drilling $1,000,000 3 $2,000,000 2.5 pilot test drilling and testing $3,000,000 7 $6,000,000 8 4 pilot testing 5 commercial development $30,000,000 72 $60,000,000 76 Total $42,000,000 100 $79,000,000 Shallow costs assume a total well depth of m Costs deep assume a well depth of 1000–1500 m Stage 4 pilot testing cost include applications of new drilling and stimulation techniques to optimize production from test wells

87
Economics of Coalbed Methane Development
Key Messages Gas production, development cost management and market price are critical to financial success Most commonly, success is coupled with economy of scale development Limited risk in finding the CBM Reservoir Significant risk associated with capital investment versus gas production Application of technology can: Enhance productivity of wells Lower capital costs for development Government taxation/royalty needs to be reasonable to ensure a rate of return on investment

88
Government Royalty and Regulatory Structure
Alberta government sliding royalty scale based upon daily production rate 0.00 5.00 10.00 15.00 20.00 25.00 30.00 35.00 100 200 300 400 500 600 700 800 900 1000 Average Daily Gas Production - ADP - (mcf/day) Royalty Rate (%) Horseshoe Canyon CBM Mannville CBM
 Royalty Rate (%) Horseshoe Canyon CBM. Mannville CBM.")
89
Early Indonesian CBM Experience
Why? CBM plays worldwide are known to be very sensitive to cost and gas prices Need sufficient revenue to justify the expenses of development Reasonable rate of return for the company for the development to go ahead What? Enough GIP (recoverable reserves) Sufficiently high gas price Using technological developments to reduce costs in all area of activities How? Review Current Processes and Practices Identify Value Adding Opportunities Make recommendations based on current and previous industry experiences
 Sufficiently high gas price. Using technological developments to reduce costs in all area of activities. How Review Current Processes and Practices. Identify Value Adding Opportunities. Make recommendations based on current and previous industry experiences.")
90
Shale has a big impact on pricing in N. America
US GAS PRODUCTION TCF / YEAR The rise of shale gas production in US ultimately led to the massive drop in US gas price However, we don’t expect similar impact on gas price in Indonesia because of different maturity level of shale industry in Indonesia Shale success factors US Ind Land access and operability Open access infrastructure, technology and equipment Capability of workforce & service sector Access to extensive gas distribution network Established fiscal and regulatory regimes Regional Spot Gas Prices US$/MMBTU Source: EIA Annual Energy Outlook 2011, 2010, 2009 Update

91
Accessible potential resource
A large number to start with: 5 Qcf (yes, that’s quadrillion) gas in place A realistic view of accessibility, play risk, and recovery factor…. Still a large number! More than half the potential plays are not geologically viable TCF Estimated 28% of USA’s shale plays actually work, 24% of China’s. 2,500 Reasonable range would be Tcf 1,800 425 GIP Immature shales, low gas contentImmature shales, low gas contentImmature shales, low gas content Inaccessible Risk (plays that "don’t work")Risk (plays that "don’t work")Risk (plays that "don’t work") Not RecoverableNot Recoverable Recoverable Source: Modified from IHS
 gas in place. A realistic view of accessibility, play risk, and recovery factor…. Still a large number! More than half the potential plays are not geologically viable. TCF. Estimated 28% of USA’s shale plays actually work, 24% of China’s. 2,500. Reasonable range would be Tcf. 1, GIP. Immature shales, low gas contentImmature shales, low gas contentImmature shales, low gas content. Inaccessible. Risk (plays that don’t work )Risk (plays that don’t work )Risk (plays that don’t work ) Not RecoverableNot Recoverable. Recoverable. Source: Modified from IHS.")
92
What makes a good shale play…the economist’s view
All technical factors and above-ground issues can be distilled into two elements: Gas maturity Water disposal options Depth TOC Clay content Infrastructure/roads Frackability Water availability Pressure gradient Services availability Quartz and Calcite Community engagement Permeability NIMBY Terrain Resource Accessed per Well (EUR) Drilling Cost per Well Both are relatively unknown for Indonesia’s shales Our analysis focuses on a broad range of potential outcomes
 Drilling Cost per Well. Both are relatively unknown for Indonesia’s shales. Our analysis focuses on a broad range of potential outcomes.")
93
Resource accessed per well (not all plays are equal)
Defining characteristic is resource per well (EUR) Dramatic swings in resource/well in known shale plays worldwide Each play has its own unique production type curve Liquids content can drive economics Poland Shale Algeria Shale Duvernay Shale Total Well Cost (USD$MM) Eagleford-Gas- Condensate Eagleford-Dry Gas Montney Utica-Quebec Pierre Barnett Barnett Southwest Estimated Ultimate Recovery (BCF per well) Source: WoodMackenzie
 Dramatic swings in resource/well in known shale plays worldwide. Each play has its own unique production type curve. Liquids content can drive economics. Poland Shale. Algeria Shale. Duvernay Shale. Total Well Cost (USD$MM) Eagleford-Gas- Condensate. Eagleford-Dry Gas. Montney. Utica-Quebec. Pierre. Barnett. Barnett Southwest. Estimated Ultimate Recovery (BCF per well) Source: WoodMackenzie.")
94
Drilling and Completions cost is 80-90% of total capital requirement
Drilling cost per well Development Drilling is the bulk of capital spending (includes completion) Completions (fracking) is approximately half the drilling cost Facilities spending ~10% for dry gas, slightly more for liquids-rich plays Development Drilling (Drilling) 43% Facilities Drilling and Completions cost is 80-90% of total capital requirement Abandonment Exploration Appraisal Completions (Fracking) 43%
 Completions (fracking) is approximately half the drilling cost. Facilities spending ~10% for dry gas, slightly more for liquids-rich plays. Development Drilling (Drilling) 43% Facilities. Drilling and Completions cost is 80-90% of total capital requirement. Abandonment. Exploration. Appraisal. Completions (Fracking) 43%")
95
What is the cost of supply
Cost of supply determined by drilling cost and resource accessed per well In a modest EUR shale (3.0 BCF/well), 680 wells would be required to get a meaningful play of 250 MMCFD The range is substantial (from $7/BOE to $37/BOE) Barnett Shale Analogue EUR 3.0 BCF/well 303 MMBOE Plateau ~250 MMCFD Montney Shale Analogue EUR 6.0BCF/well 606 MMBOE Plateau ~500 MMCFD Eagleford Shale “sweet spot” EUR 6.0BCF/well + cond 926 MMBOE Plateau ~500 MMCFD and 46 MBBLD condensate $8 million/well Total cost: $6.5 billion Supply cost: $21.5/BOE Total cost: $6.7 billion Supply cost: $11.1/BOE Total cost: $6.9 billion Supply cost: $7.4/BOE $11 million/well Total cost: $8.5 billion Supply cost: $28.1/BOE Total cost: $8.8 billion Supply cost: $14.5/BOE Total cost: $8.9 billion Supply cost: $9.6/BOE $15 million/well Total cost: $11.2 billion Supply cost: $36.8/BOE Total cost: $11.4 billion Supply cost: $18.8/BOE Total cost: $11.5 billion Supply cost: $12.4/BOE
, 680 wells would be required to get a meaningful play of 250 MMCFD. The range is substantial (from $7/BOE to $37/BOE) Barnett Shale Analogue. EUR 3.0 BCF/well 303 MMBOE. Plateau ~250 MMCFD. Montney Shale Analogue. EUR 6.0BCF/well. 606 MMBOE Plateau ~500 MMCFD. Eagleford Shale sweet spot EUR 6.0BCF/well + cond. 926 MMBOE Plateau ~500 MMCFD and 46 MBBLD condensate. $8 million/well. Total cost: $6.5 billion. Supply cost: $21.5/BOE. Total cost: $6.7 billion. Supply cost: $11.1/BOE. Total cost: $6.9 billion. Supply cost: $7.4/BOE. $11 million/well. Total cost: $8.5 billion. Supply cost: $28.1/BOE. Total cost: $8.8 billion. Supply cost: $14.5/BOE. Total cost: $8.9 billion. Supply cost: $9.6/BOE. $15 million/well. Total cost: $11.2 billion. Supply cost: $36.8/BOE. Total cost: $11.4 billion. Supply cost: $18.8/BOE. Total cost: $11.5 billion. Supply cost: $12.4/BOE.")
96
Government of Indonesia can consider various fiscal term options
IMPACT “Status Quo” Limited investment Only a very small portion of shale potential can be developed Keep the PSC terms as they currently are “Early incentive ” Gold rush effect possible Could mean giving away too much May face resistance when attempting to make the terms stricter Improve all terms for shale at early stage and possibly tighten the terms at later stage “Sliding scale” Complicated Limits the potential gain each company can get May not get it right until you know what you have Build some form of a variable scale on terms on parameters e.g. EUR, profitability Keep terms as are – limited investment, expect only small ptn accessed Improve all terms for shale now (maybe make harsher later) – gold-rush effect possible, need to tighten them later, could mean giving away too much Build some form of variable scale on terms (EUR, IP, profitability) – Complicated, may still not get it right until you know what you’ve got Defer the decision, but commit to a range of contractor IRR’s (define specifics at POD time) – May not encourage investment, but preserves optionality and sends a message that we’re in it together Preserves flexibility Convey the message that we are in it together Uncertainty in final terms may make it difficult to get through corporate approval “Flexible” Defer the decision, but commit to a minimum range of contractor IRRs. Specifics of the terms will be set after POD submission
 – gold-rush effect possible, need to tighten them later, could mean giving away too much. Build some form of variable scale on terms (EUR, IP, profitability) – Complicated, may still not get it right until you know what you’ve got. Defer the decision, but commit to a range of contractor IRR’s (define specifics at POD time) – May not encourage investment, but preserves optionality and sends a message that we’re in it together. Preserves flexibility. Convey the message that we are in it together. Uncertainty in final terms may make it difficult to get through corporate approval. Flexible Defer the decision, but commit to a minimum range of contractor IRRs. Specifics of the terms will be set after POD submission.")
Presentasi serupa
 Anything needed by an organism or group of organism. Something useful (but for humanity what is useful or useless can change because.>")


 Hidsal Jamil(135020100111028) Padel Aji Pamungkas(135020100111042)>")


 Water (from ground) Oxygen (to.>")