Upload presentasi
Presentasi sedang didownload. Silahkan tunggu

1
Business Performance Measurement Ign Teodore Teddy Saputra MBA
Chapter / Week XI Reference

2
Pertemuan ke : Materi Bahan 1 Dasar-dasar Manajemen Strategi Buku 3: 1 dan 2 2 Evolusi Manajemen Strategi Buku 1: 1 3 Lingkungan Ekternal Buku 2: 2 4 Presentasi Lingkunan Ekternal 5 Lingkungan Internal Buku 2: 3 6 Presentasi Lingkungan Internal 7 Review dan Kuis 8 UTS 9 Business Level strategy dan Corporate Level Strategy Buku 2: 4 dan 6 10 Identifikasi Key Success Factor Buku 1: 4 11 Perancangan Pengukuran Performance of Business Process untuk tumbuh secara berkelanjutan Buku 1: 8 dan 9 Buku 2:12 Buku 3: 9 dan 6 12 13 Kuis 14 Management Strategi dan Entrepreneurship Buku 2: 13 15 Management Strategi dan Family Business Buku 1:3 16 UAS +kumpul paper

3
When you can measure what you are speaking about, and express it in numbers, you know something about it; but when you cannot measure it, when you cannot express it in numbers, your knowledge is of a meager and unsatisfactory kind. William Thompson (Lord Kelvin),
,")
4
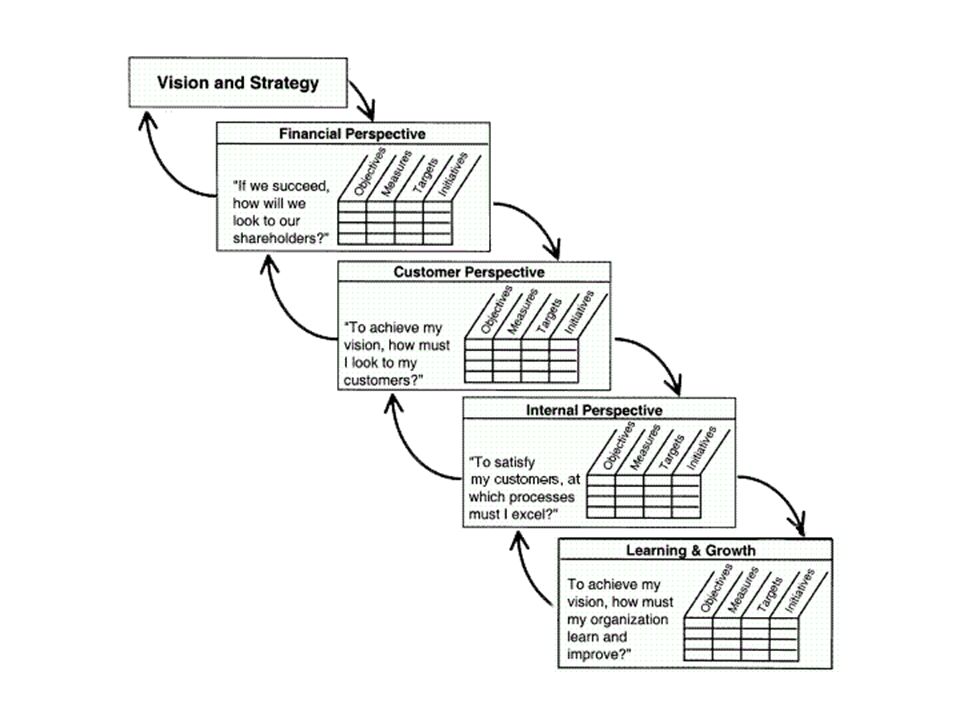
Balance Score Card

5
What is the balanced scorecard?

6
Customer Needs Who is your customer?
What age, gender, group does our product appeal to? What services or products do they expect from you? Do we provide personal services, do your products serve as advertised? How do you listen to and learn from your customers? Do we provide feedback calls or s? How do you retain and acquire new customers? Do we use new advertisement and how do we advertise? How do you meet customers’ needs? Do we provide help lines and how can we provide help to customers? How do you measure customer satisfaction and dis-satisfaction? Do we use surveys to find out how customers feel about us?

7
Customer Concerns There are four major categories that managers need to address when concerning their customers. Quality Are there often recalls or problems with defects with our products. Time Do we save time by limiting defects and do we provide fast on time delivery. Performance and service Do we perform up to customers standards and do we provide fast and adequate services. Cost Do we try to minimize cost when dealing with ordering, scheduling delivery, and paying for materials in order to lower cost of our products to our consumers.

8
Customer Perspective With customer perspective managers and companies have to be careful and make sure they are setting up their balance scorecard to help customers. Examples of things that don’t concern customers are profit per customer, revenue per customer, and improve profit per customer. These objectives don’t necessarily protean to the customer perspective but rather the companies perspective of the customer. Managers need to take a step back and look at how customers perceive your company and what they want to get out of your company.

9
Examples of Customers Perspective
Two main questions that a company should ask itself to protean to their customers are: How should we appear to our customers Do we show a promising future Do we show a strong sense of concern What is our differentiating value proposition to our targeted customers How are we different from our competitors What makes us better than our competitors

10
Perspectives of Kaplan and Norton
There are four broad categories that Kaplan and Norton base the customer perspective around. Best buy Companies that supply services and products at low prices and fast service. Product leadership and innovation Companies that focus on customer that buy the newest and most advanced cutting edge technology. Customer complete solutions Companies that try to sell things like computers where customers customize them to their liking. Lock in Companies that will make a product then to buy accessories for that product you have to buy the same brand name because other brands out work with that product.

11
Successful balanced Scorecards
When using critical thinking of strategy, objectives, and measures companies can get a feel for who their customers are and what they can offer them. Strategy gurus, like Michael Porter stress the fact that it is more important to accomplish more with less. Don’t try to please everyone when setting up your balanced scorecard because you can’t.

12
Internal Processes Internal business process objectives address the question of which processes are the most critical for satisfying customers and shareholders A firm must concentrate its efforts to excel in these areas Metrics based on this prospective allow the managers to know how well their business is running and whether its products and services conform to customer requirements

13
Internal Process Examples
Cost Throughput Quality Objective Specific Measure Manufacturing excellence Cycle time, yield Increase design productivity Engineering efficiency Reduce product launch delays Actual launch date vs. plan

14
Internal Processes In addition to the strategic management process two kinds of business processes may be identified, these include: Mission-oriented processes - special functions of government offices which often involve many unique problems in their processes Support processes - more repetitive in nature.

15
Financial Performance
The financial performance perspective of the balanced scorecard addresses the question of how shareholders view the firm and which financial goals are desired from the shareholder’s perspective. These financial goals are dependent on the company’s stage in the business life cycle.

16
Financial Performance: Business Life Cycle
There are three main stages to this cycle which include: Growth stage -goal of the company is growth An example of a growth goal would be revenue growth. Sustain stage - the goal of the firm is profitability Measures in this stage may include ROE, ROCE, and EVA. Harvest stage - the goal of the firm is cash flow and reduction in capital requirements.

17
Financial Performance
The table below outlines possible financial performance objectives and their metrics. Objective Specific Measure Growth Revenue Growth Profitability Return on equity Cost Leadership Unit Cost

18
Learning & Growth

19
“How much a company must learn, improve, and innovate to meet objectives.”

20
Use of the scorecard: To set objectives To determine measures
To predict outcomes To determine initiatives To gain the big picture

21
Key performance indicators include:
Illness rate/days of absence Employee turnover Gender/racial ratios Internal promotion %

22
A learning & growth example:
Objective: increase internal promotions Measure: bigger % of in house promotions Target: +10% in 2 years Additional classes and training

23
“A balanced scorecard system provides a basis for executing good strategy well and managing change.”
-Howard Rohm

24
Learning & growth must focus on measurable outcomes to move the company forward.

25
Scorecard allows for actionable terms derived from company strategy.

26
Makes it easier for management to carry out strategy.
Balanced Scorecard Makes it easier for management to carry out strategy.

27
4 step process Define measurement architecture
Specify strategic objectives Choose strategic measures Develop implementation plan

28
Potential Benefits Translation of strategy into measurable parameters
Communication of strategy Alignment of individual goals with strategic objectives Feedback of implementation results

29
Potential Disadvantages
Lack of a well defined strategy Use of only lagging measures Use of generic metrics

30
Conclusion Balanced scorecard is a performance management system that can be used in any size organization. Allows management to measure financial and customer results, operations, and organization potential.

31
The challenge strategic leaders face is to verify that their firm is emphasizing financial
and strategic controls so that firm performance improves. The Balanced Scorecard is a tool that helps strategic leaders assess the effectiveness of the controls.

32
Fokus keuangan memiliki keterbatasan yaitu: Tidak revelan
Awalnya pengukuran kinerja adalah pengukuran kinerja keuangan (financial) Pendekatan klasik Balance Scorecard, manajemen kinerja dengan siklus PDCA, Performance Prism Fokus keuangan memiliki keterbatasan yaitu: Tidak revelan Orientasi masa lalu Tidak fleksibel Tidak dapat memicu perbaikan Biaya menjadi rancu Pendekatan modern Pendekatan modern: Mengukur financial dan non financial Non Financial memberikan jawaban atas hasil dari pengukuran financial Evaluasi non financial mendorong perubahan organisasi ke arah yang lebih baik PDCA: Plan Do Check Action
 Pendekatan klasik. Balance Scorecard, manajemen kinerja dengan siklus PDCA, Performance Prism. Fokus keuangan memiliki keterbatasan yaitu: Tidak revelan. Orientasi masa lalu. Tidak fleksibel. Tidak dapat memicu perbaikan. Biaya menjadi rancu. Pendekatan modern. Pendekatan modern: Mengukur financial dan non financial. Non Financial memberikan jawaban atas hasil dari pengukuran financial. Evaluasi non financial mendorong perubahan organisasi ke arah yang lebih baik. PDCA: Plan Do Check Action.")
33
Konsep Balance Scorecard
Balanced Scorecard merupakan management tool yang digunakan untuk meningkatkan kemampuan organisasi dalam melipatgandakan kinerja keuangan. Balanced Scorecard mengukur performa financial maupun nonfinancial Balanced Scorecard sangat cocok dipergunakan di Business level strategy walau tidak menutup kemungkinan dipergunakan untuk korporasi. The Balanced Scorecard menjabarkan strategi ke dalam sistim yg tergintegrasi yg mencakup: Outcomes (lag indicators) and Performance drivers (lead indicators) Internal and External Perspectives Qualitative and Quantitative Information Limited number of indicators
 and Performance drivers (lead indicators) Internal and External Perspectives. Qualitative and Quantitative Information. Limited number of indicators.")
34
BSC Overview Balanced Scorecard
BSC Concept BSC Overview Scorecard (kartu skor) adalah kartu yang digunakan untuk mencatat skor performance seseorang. Kartu skor juga dapat digunakan untuk merencanakan skor yang hendak diwujudkan oleh seseorang di masa depan. Balanced Scorecard Kata balanced (berimbang) berarti adanya keseimbangan antara performance keuangan dan non-keuangan, antara performance jangka pendek dan performance jangka panjang, dan antara performance yang bersifat intern dan performance yang bersifat ektern.
 adalah kartu yang digunakan untuk mencatat skor performance seseorang. Kartu skor juga dapat digunakan untuk merencanakan skor yang hendak diwujudkan oleh seseorang di masa depan. Balanced Scorecard. Kata balanced (berimbang) berarti adanya keseimbangan antara performance keuangan dan non-keuangan, antara performance jangka pendek dan performance jangka panjang, dan antara performance yang bersifat intern dan performance yang bersifat ektern.")
35
Balance Scorecard

37
Divided KSF into 4 Perspective
How To Create BSC Vision-Mission Strategy KSF Divided KSF into 4 Perspective KPI

38
Perspektif Finansial Ukuran kinerja finansial memberikan petunjuk apakah strategi perusahaan, implementasi, dan pelaksanaannya memberikan kontribusi atau tidak kepada peningkatan laba perusahaan. Tujuan finansial biasanya berhubungan dengan profitabilitas melalui pengukuran laba operasi, return on capital employed (ROCE) atau economic value added. Tujuan finansial lainnya mungkin berupa pertumbuhan penjualan yang cepat atau terciptanya arus kas.
 atau economic value added. Tujuan finansial lainnya mungkin berupa pertumbuhan penjualan yang cepat atau terciptanya arus kas.")
39
Perspektif Pelanggan Perspektif pelanggan mengukur kepuasan pelanggan, retensi pelanggan, akuisisi pelanggan baru, profitabilitas pelanggan, dan pangsa pasar di segmen sasaran. Perspektif pelanggan juga mencakup berbagai ukuran tertentu yang menjelaskan tentang proposisi nilai yang akan diberikan perusahaan kepada pelanggan segmen pasar tertentu merupakan faktor yang penting, yang dapat mempengaruhi keputusan pelanggan untuk berpindah atau tetap loyal kepada pemasoknya.

40
Perspektif Pelanggan Sebagai contoh, pelanggan mungkin menghargai kecepatan (lead time) dan ketepatan waktu pengiriman atau produk dan jasa inovatif. Perspektif pelanggan memungkinkan para manajer unit bisnis untuk mengartikulasikan strategi yang berorientasi kepada pelanggan dan pasar yang akan memberikan keuntungan finansial masadepan yang lebih besar.

41
Perspektif Proses Bisnis Internal
Perspektif proses bisnis internal mengidentifikasi berbagai proses internal penting yang harus dikuasai dengan baik oleh perusahaan.

42
Contoh

43
Strategic Objectives & Measures
FI Maximize Financial Returns Revenue Growth Increase New Revenue Sources Increase Market Share Increase CVP Increase Price Maintain Profit Margin Productivity Improve Cost Structure Reduce Admin Cost Improve Asset Utilization Reduce Average Warehouse Value IRR, NPV ROCE Revenue Growth (%) Market Share (%) PriceGrowth (%) Profit Margin (%) Admin Cost ($) Average Warehouse Value ($)
 Market Share (%) PriceGrowth (%) Profit Margin (%) Admin Cost ($) Average Warehouse Value ($)")
44
Strategic Objectives & Measures
CU “Trusted, friendly, convenient and affordable” Friendly and welcoming staff Available and knowledgeable staff Professional service & complaint handling Easy parking Delivery within 24 hrs Fast credit approval Quality furniture Affordable financing Popular Models Only Customer Staff Friendlyness Rating (%) Customer Staff Availabity Rating (%) Customer Staff Knowledge Index (%) Customer Service Level Index (%) Customer Parking Availability Index (%) Customer Delivery Rating (%) Customer Credit Approval Rating (%) Customer Furniture Quality Rating (%) Customer Financing Rating (%) Customer Selection Rating (%)
 Customer Staff Availabity Rating (%) Customer Staff Knowledge Index (%) Customer Service Level Index (%) Customer Parking Availability Index (%) Customer Delivery Rating (%) Customer Credit Approval Rating (%) Customer Furniture Quality Rating (%) Customer Financing Rating (%) Customer Selection Rating (%)")
45
Strategic Objectives & Measures
IP Sufficient staff in shop at all times Handle all complaints on the spot Always a free parking spot Deliver the right products to the right address within 18 hrs Handle credit requests in 10 minutes Keep quality complaints at minimum No item in selection at over 250$ a month financing 4 week selection turn-over max. Reduce no of un-pop. of items in selection Staff in Shop (#.) Complaint Handled on the spot (%) Hours with no parking spot available (hours) No. of products deliver more than 18 hrs (#) Credit Request Handled in 10 minutes (%) Quality complaint per 100 purchases (#) Items with more than $250 per month financing (#) No. of items above 4 week turn-over limit (#) No. of un-pop items in selections (#)
 Complaint Handled on the spot (%) Hours with no parking spot available (hours) No. of products deliver more than 18 hrs (#) Credit Request Handled in 10 minutes (%) Quality complaint per 100 purchases (#) Items with more than $250 per month financing (#) No. of items above 4 week turn-over limit (#) No. of un-pop items in selections (#)")
46
Strategic Objectives & Measures
LG All staff members through Basic Sales Training All staff members through Selection Training Reduce number of admin employees Using Technology to improve process effectiveness All staff members through SWA Operating Training Percentage of employees with Basic Sales Training Certificate (%) Percentage of employees with current Selection Certificate (%) Number of Admin Employees (#) Percentage of Overhead Cost Reduction (%) Cost Effectiveness (%) Percentage of employees with SWA Certificate Note: SWA = Store Workflow Automation
 Percentage of employees with current Selection Certificate (%) Number of Admin Employees (#) Percentage of Overhead Cost Reduction (%) Cost Effectiveness (%) Percentage of employees with SWA Certificate. Note: SWA = Store Workflow Automation.")
47
Key BSC terminology Strategy Map: Diagram of the
cause-and-effect relationships between strategic objectives Strategic Theme: Operating Efficiency Objectives Fast ground turnaround Statement of what strategy must achieve and what’s critical to its success Measurement On Ground Time On-Time Departure How success in achieving the strategy will be measured and tracked Target 30 Minutes 90% The level of performance or rate of improvement needed Cycle time optimization Key action programs required to achieve objectives Initiative Financial Profitability Fewer planes More customers Customer Flight Is on time Lowest prices Internal Fast ground turnaround Learning Ground crew alignment

48
Strategic Theme: Operating Efficiency
Balanced Scorecard Example Strategic Theme: Operating Efficiency Objectives Measurement Target Initiative Financial Profitability Profitability More Customers Fewer planes Market Value Seat Revenue Plane Lease Cost 30% CAGR 20% CAGR 5% CAGR Fewer Planes More Customers Customer Flight is on -time Lowest prices FAA On Time Arrival Rating Customer Ranking (Market Survey) #1 Quality management Customer loyalty program Flight Is on Time Lowest Prices Internal Fast ground turnaround On Ground Time On-Time Departure 30 Minutes 90% Cycle time optimization program Fast Ground Turnaround Ground crew alignment % Ground crew trained % Ground crew stockholders yr % yr % yr % ESOP Ground crew training Learning Ground Crew Alignment
 #1. Quality management. Customer loyalty program. Flight. Is on Time. Lowest. Prices. Internal. Fast ground turnaround. On Ground Time. On-Time Departure. 30 Minutes. 90% Cycle time optimization program. Fast Ground. Turnaround. Ground crew alignment. % Ground crew trained. % Ground crew stockholders. yr. 1 70% yr. 3 90% yr % ESOP. Ground crew training. Learning. Ground Crew. Alignment.")
50
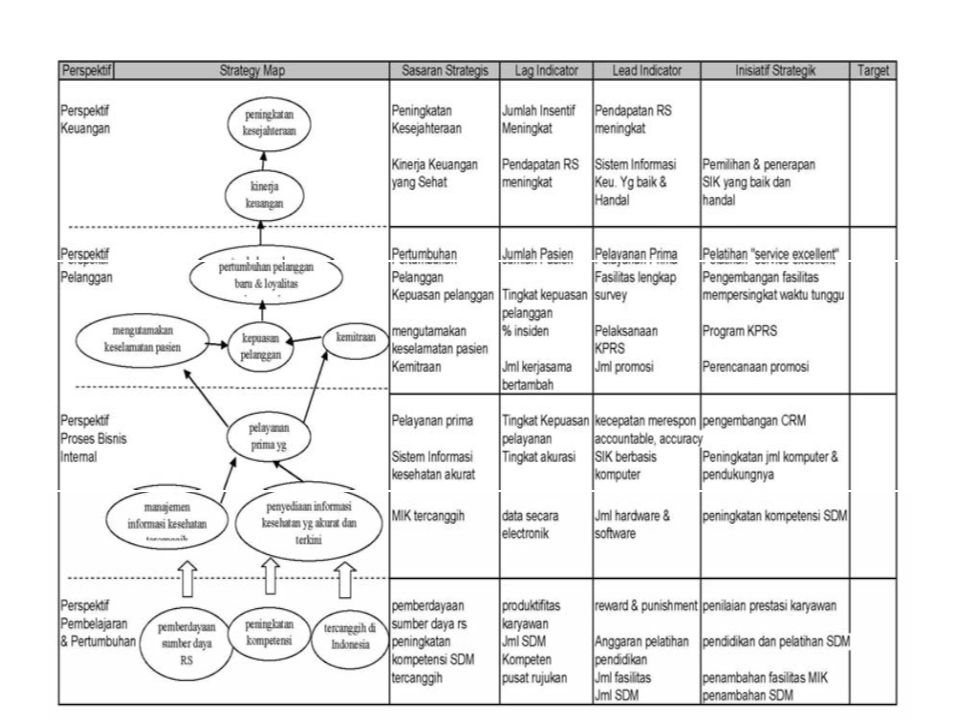
Balanced Scorecard XXX
Strategic Map Sasaran Strategis Lag Indicator Lead Indicator Target Initiative Strategik Programs Financial Customer Internal Learning Lagging indicator– outcomes yang dijadikan tujuan Leading indicator– cara untuk mencapai laggingnya

51
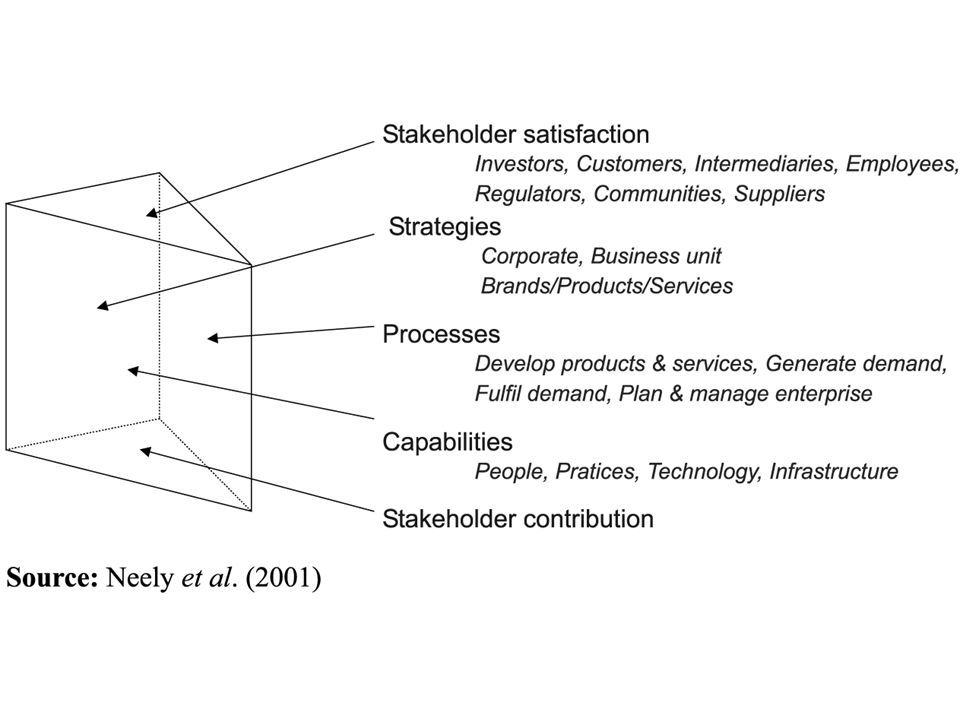
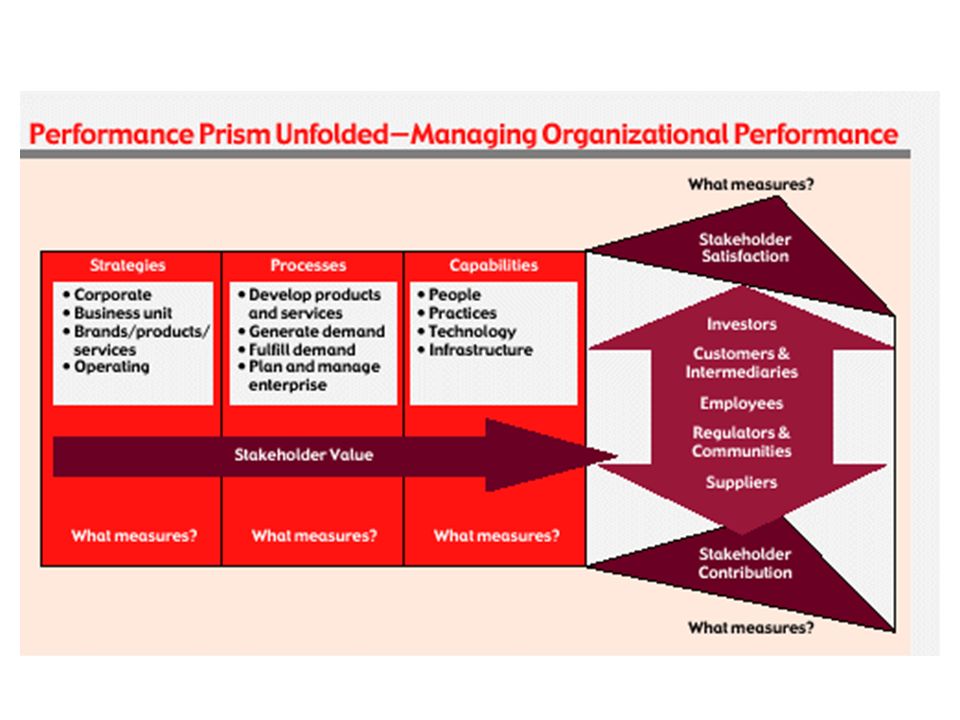
Performance Prism Muncul pada 2002 Konsep yang dibawa:
Framework 3 dimensi yang membentuk segitiga prism dengan lima segi yang masing-masing mewakilli: Stakeholder satisfaction Stakeholder contribution Strategi Proses Kapabilitas

54
Think about a range of stakeholders
Fast, Right, Cheap & Easy Purpose, Care, Skills & Pay Trust, Loyalty, Profit & Growth Legal, Fair, Safe & True Return, Reward, Figures & Faith Stakeholder Satisfaction (Stakeholder Wants & Needs) Stakeholders Customers & Intermediaries Employees Regulators & Communities Suppliers Investors Stakeholder Contribution (Organization Wants & Needs) Trust, Loyalty, Profit & Growth Hands, Hearts, Minds & Voices Fast, Right, Cheap & Easy Rules, Reason, Clarity & Advice Capital, Credit, Risk & Support Remember stakeholder contribution satisfaction
 Stakeholders. Customers & Intermediaries. Employees. Regulators & Communities. Suppliers. Investors. Stakeholder Contribution. (Organization Wants & Needs) Trust, Loyalty, Profit & Growth. Hands, Hearts, Minds & Voices. Fast, Right, Cheap & Easy. Rules, Reason, Clarity & Advice. Capital, Credit, Risk & Support. Remember stakeholder contribution satisfaction.")
55
The Performance Prism What do our various stakeholders want and need?
SWANs What do our various stakeholders want and need? Strategies What strategies are we pursuing to satisfy these wants and needs? Processes What processes do we need to put in place to enable us to achieve these strategies? Capabilities What capabilities do we require if we are to operate these processes? OWANs What do we want and need from our stakeholders to enable all of this to happen? Neely, A.D., Adams, C. and Kennerley, M. (2002) “The Performance Prism: The Scorecard for Measuring and Managing Stakeholder Relationships”, Financial Times/Prentice Hall, London.
 The Performance Prism: The Scorecard for Measuring and Managing Stakeholder Relationships , Financial Times/Prentice Hall, London.")
56
Reflections on CSR and disclosure
Don’t start with what should we measure. Instead start with what questions do we want to be able to answer. The questions that matter for different organisations are context dependent. So do not look for standardised sets of measures that can be used for CSR. We can, however, look for standardised frameworks – such as the Performance Prism – to help structure our thinking. Finally… remember Einstein…

57
Starting with Kelvin, finishing with Einstein
“Not everything that counts can be measured. Not everything that can be measured counts”. Albert Einstein,

58
Thank U

59
MIKE DUKE WAL MART CEO

60
WALMART

61
WALMART STRATEGY

Presentasi serupa