Upload presentasi
Presentasi sedang didownload. Silahkan tunggu

2
Process Modeling Tsutomu Ono, Abdul Munif Japan International Cooperation Agency 1

3
Pengertian Process modeling=Preocess Analisys Model=pemodelan fungsional & aliran informasi Informasi ditransformasikan pada saat dia mengalir melalui sebuah sistem berbasis komputer. Sistem tersebut menerima input dengan berbagai cara dan menghasilkan suatu output. Akibatnya kita dapat menciptakan suatu model aliran bagi setiap sistem berbasis komputer tanpa melihat ukuran dan kompleksitasnya. Dikenal juga dengan sebutan grafik aliran data atau buble chart.

4
Data Flow Diagram (DFD) Teknik grafis menggambarkan aliran informasi dan transformasi yang diaplikasikan pada saat data bergerak dari input menjadi output Teknik analisis digunakan untuk menggambarkan aliran input dalam sebuah sistem (sekumpulan proses) serta output yang dihasilkan. Menggambarkan apa yang terjadi dalam sebuah sistem. Lebih mudah melihat gambar & memahami isinya dibandingkan membaca banyak dokumen ; untuk menejelaskan sebuah sistem memberi gambaran bagaimana data berubah sejalan dengan alirannya dalam sistem menggambarkan fungsi-fungsi yang mengubah data data dalam sistem.

5
4 Data Flow Diagram (DFD) DFD is a drawing that shows how a system’s environmental elements, processes, and data are interconnected. DFDs typically exist in a hierarchy. A diagram on a lower level expends a process on the level immediately above, providing more detail. A DFD is a type of decomposition diagram, sub dividing a system into lower-level systems, or subsystems. When systems analysts attempt to understand the information requirements of users, they must be able to conceptualize how data move through the organization, the processes or transformation that data undergo, and what the outputs are.

6
Flowchart terdiri dari box-box yang mendeskripsikan : –Komputasi –Decision / Keputusan –Iterasi –Loop Data Flow Diagram bukan Flowchart program dan tidak mempunyai elemen kontrol

7
6 DFD Symbols The four basic symbols used in DFD, their meanings, and examples SymbolsMeaningExample Entity (Source or destination of data) Student New Student Information Flow of Data Student Master Process (which transforms a flow of data) Create Student Record Data store
 Student New Student Information Flow of Data Student Master Process (which transforms a flow of data) Create Student Record Data store")
8
7 Data Flow Diagram (DFD) The Hierarchical Arrangement of DFDs A diagram on a lower level expands a process on the level immediately above, providing more detail. The Context Diagram The DFD on the highest level. It describes the system in the context of its environment The Figure 0 Diagram The DFD on the second level in the hierarchy Figure n Diagrams On the next lower level with such names as figure 1, figure 2 diagrams Lower-level DFDs The same top-down decomposition of the system structure can be contained to lower levels Example: Figure 1 diagram can be sub divided into 1.1, 1.2,,,

9
Struktur DFD

11
10 The Context Diagram for an Order Entry System

12
11 Figure 0 Diagram for an Order Entry System

13
12 Mini Project – Software Shop: Please draw DFDs based on the business of Inul’s Software Shop in Malang: Backgrounds: 1.Inul’s Software Shop buys software from various suppliers 2.The shop sells it to the public 3.She stocks popular software packages and orders others as required 4.She extends credit to institutions, cooperates, and some individuals. Exercises: - Draw Context diagram - Draw Figure 0 diagram - Draw Figure n diagrams to complete the DFDs Hints: Entities: CUSTOMER, SUPPLIER, Data Store: PACKAGE DATA, CUSTOMER DATA, and so on.

14
13 Practice: Sample Context Diagram

15
14 Practice: Sample Figure 0 Diagram

17
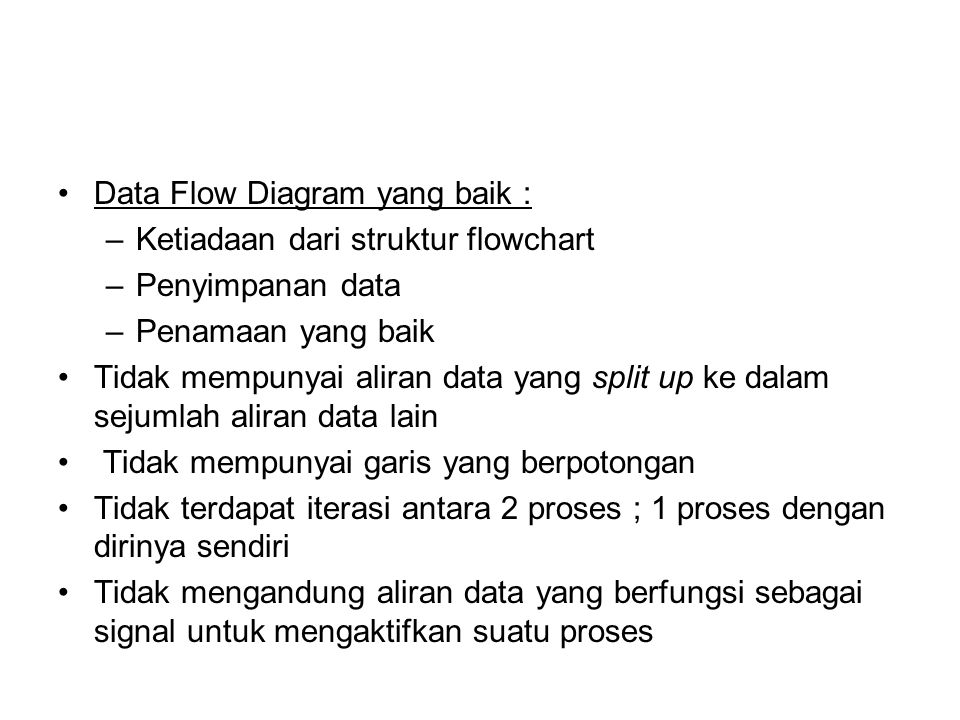
Data Flow Diagram yang baik : –Ketiadaan dari struktur flowchart –Penyimpanan data –Penamaan yang baik Tidak mempunyai aliran data yang split up ke dalam sejumlah aliran data lain Tidak mempunyai garis yang berpotongan Tidak terdapat iterasi antara 2 proses ; 1 proses dengan dirinya sendiri Tidak mengandung aliran data yang berfungsi sebagai signal untuk mengaktifkan suatu proses

19
BPM (Bussiness Process Model) Menyatakan aliran seluruh proses dalam sistem dari awal hingga akhir Terdapat decision process, paralel process Melibatkan resourses database
 Menyatakan aliran seluruh proses dalam sistem dari awal hingga akhir Terdapat decision process, paralel process Melibatkan resourses database")
20
BPM (Bussiness Process Model) A Business Process Model (BPM) is a conceptual model which provides a close description of the business logic and rules from a business partner's point of view. A BPM uses a diagram that shows interactions between processes, flows, messages and collaboration protocols from one or several start points to several potential end points. A BPM can be compared to a market place where data or services are exchanged. It usually arises from a compelling business need or opportunity. BPM is a simplified UML activity diagram with Business Process extensions..

21
BPM (Bussiness Process Model) It isnot include any implementation details. It can be readily used as an input document to do object- oriented analysis At a conceptual level, it is particularly suitable for analyzing, designing or documenting Business-to-Business exchanges (B2B). You use a BPM to: –·Describe the behavior and requirements of a system –·Represent the conceptual organization of objects in a graphic format –·Open PAM models –·Generate a BPM –·Design or document ebXML BPSS
. You use a BPM to: –·Describe the behavior and requirements of a system –·Represent the conceptual organization of objects in a graphic format –·Open PAM models –·Generate a BPM –·Design or document ebXML BPSS.")
23
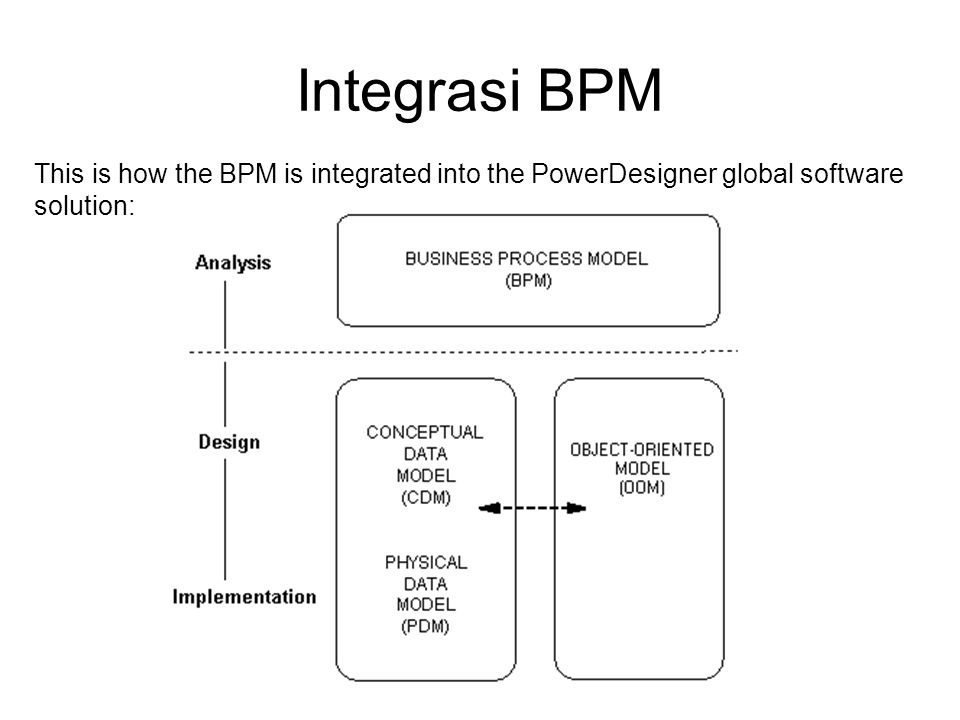
Integrasi BPM This is how the BPM is integrated into the PowerDesigner global software solution:

26
Accounting dept Sales dept Warehausing dept

27
Accounting dept Warehausing dept

Presentasi serupa