Upload presentasi
Presentasi sedang didownload. Silahkan tunggu

1
D10K-6C01 Pengolahan Citra PCD-04 Algoritma Pengolahan Citra 1
Program Studi S-1 Teknik Informatika FMIPA Universitas Padjadjaran Semester Genap

2
Algoritma Pengolahan Citra 1
Operasi berbasis titik (point proses) Image enhancement Algoritma Pengatur kecerahan citra Inversi citra Konversi citra ke citra keabuan Thresholding Look-Up Table (LUT) Ekualisasi histogram Contrast stretching
 Image enhancement. Algoritma. Pengatur kecerahan citra. Inversi citra. Konversi citra ke citra keabuan. Thresholding. Look-Up Table (LUT) Ekualisasi histogram. Contrast stretching.")
3
Pengaturan Kecerahan Citra
Brightness Formulasi Contoh c adalah konstanta integer Clamping

4
Inversi Citra Operasi kebalikan (invert) dari nilai citra Formulasi
Contoh

5
Konversi Citra Ke Grayscale
Citra warna menjadi citra keabuan Metode Perataan (‘quick and dirty’) Pembobotan Desaturation Decomposition Single Color Channel Custom # of gray shades Custom # of gray shades with dithering
 Pembobotan. Desaturation. Decomposition. Single Color Channel. Custom # of gray shades. Custom # of gray shades with dithering.")
6
Metode Pembobotan pr pg pb Sebutan 0.3 0.59 0.11 Human Eye Correction
0.2126 0.7152 0.0722 Luma, ITU-R , BT.709 0.299 0.587 0.114 BT.601

7
Metode Lain Konversi ke Gray Level
Desaturation Decomposition Single color Channel

8
Contoh

9
LOOK-UP TABLE Input LUT Output 7 5 4 2 3 1 6

10
HISTOGRAM CITRA 1 3 4 5 7 2 6 ℎ 𝑖 Citra 𝑖
Tabel frekuensi kemunculan setiap warna 1 3 4 5 7 2 6 𝑖 1 2 3 4 5 6 7 𝑛 𝑖 15 12 20 13 19 8 ℎ 𝑖 0.15 0.12 0.06 0.20 0.13 0.19 0.07 0.08 ℎ 𝑖 Citra 𝑖

11
Histogram

12
Histogram Processing Histogram Equalization Histogram Specification
Hasil proses bergantung kepada kondisi data/piksel Histogram menjadi uniform Proses dilakukan secara otomatis Histogram Specification Histogram yang diinginkan dispesifikasikan

13
Perhitungan Histogram Equalization

14
Contoh Nyata Histogram Equalization

15
Ilustrasi Histogram Equalization

16
Thresholding Umumnya proses dilakukan setelah citra warna dikonversikan ke citra greylevel Hasilnya berupa citra biner Metode Simple Thresholding Multilevel/Adaptive Thresholding OTSU Thresholding Contoh

17
Representasi Citra Biner
Pengolahan Citra Dijital

18
Konsep Thresholding One-level Multi-level

19
Simple Thresholding

20
Ilustrasi 10 40 200 75 49 128 89 67 17 4 25 190 37 0 205 78 240 54 75 100 127 20 80 90 81
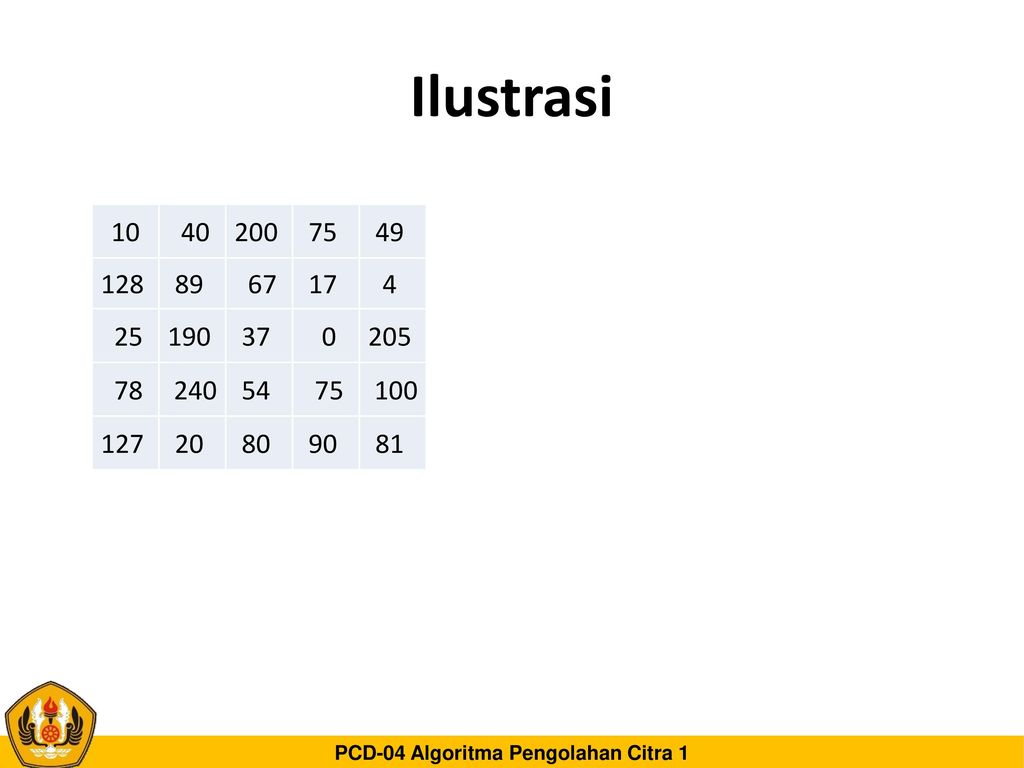
21
Multilevel / Adaptive Thresholding
Berikut merupakan langkah-langkah untuk mendapatkan nilai ambang (Gonzales, 2002): Ulangi hingga nilai-nilai 𝜇 1 dan 𝜇 2 tidak berubah lagi
: Ulangi hingga nilai-nilai 𝜇 1 dan 𝜇 2 tidak berubah lagi.")
22
Ilustrasi 10 40 200 75 49 128 89 67 17 4 25 190 37 0 205 78 240 54 75 100 127 20 80 90 81

23
OTSU Thresholding Nobuyuki Otsu, A Threshold Selection Method from Gray-Level Histograms, IEEE Transactions on System, Man, and Cybernetics. SMC-9(1), 1979, Electro-Technical Laboratory, Tokyo University(2007), Tokyo, Japan Algoritma Hitung histogram dan probabilitas untuk setiap tingkat intensitas Tentukan nilai bobot awal (ωi(0)) dan rata-rata (μi(0)) Untuk setiap t=1 sampai intensitas maksimum lakukan Perbaharui nilai ωi dan μi Hitung variansi untuk setiap t (σ2b ) Nilai optimal threshold adalah nilai minimum dari variansi pada t Kita dapat melakukan perhitungan dual maxima dengan formulasi (σ2b1 +σ2b2 )/2
, 1979, Electro-Technical Laboratory, Tokyo University(2007), Tokyo, Japan. Algoritma. Hitung histogram dan probabilitas untuk setiap tingkat intensitas. Tentukan nilai bobot awal (ωi(0)) dan rata-rata (μi(0)) Untuk setiap t=1 sampai intensitas maksimum lakukan. Perbaharui nilai ωi dan μi. Hitung variansi untuk setiap t (σ2b ) Nilai optimal threshold adalah nilai minimum dari variansi pada t. Kita dapat melakukan perhitungan dual maxima dengan formulasi. (σ2b1 +σ2b2 )/2.")
24
OTSU Thresholding

25
Ilustrasi Numeris Metode OTSU
Diketahui citra sbb: Lakukan proses histogram Pengolahan Citra Dijital

26
Ilustrasi Numeris Metode OTSU
Untuk setiap nilai intensitas hitung bobot (Wb) , rata-rata (μb) dan variansi (σ2b) untuk BG hitung bobot (Wf) , rata-rata (μf) dan variansi (σ2f) untuk FG hitung variansi didalam kelas (within class variance) σ2W = Wb σ2b +Wf σ2f Pengolahan Citra Dijital
 , rata-rata (μb) dan variansi (σ2b) untuk BG. hitung bobot (Wf) , rata-rata (μf) dan variansi (σ2f) untuk FG. hitung variansi didalam kelas (within class variance) σ2W = Wb σ2b +Wf σ2f. Pengolahan Citra Dijital.")
27
Ilustrasi Numeris Metode OTSU

28
Ilustrasi Numeris Metode OTSU
Contoh: untuk area Histogram sbb: Wb = μb = Σ2b = Wf = μf = Σ2f = σ2W = Wb σ2b +Wf σ2f

29
Ilustrasi Numeris Metode OTSU

30
Ilustrasi Numeris Metode OTSU
Yang dipilih adalah Threshold dengan nilai Within Class Variance terkecil

31
Kontras The contrast of an image is its distribution of light and dark pixels. Low contrast image Gray scale images are mostly dark, mostly light, or mostly gray In the histogram, the pixels are concentrated on the right, left, or right in the middle High contrast image Images have regions of both dark and light Utilize the full range available Problem: large regions of dark and large regions of white Good Contrast Wide range of pixel values Most pixel values are used No domination Uniform distribution of pixels
![]()
32
Contoh Kontras

33
CONTRAST STRETCHING Stretch a histogram to fill the full dynamic range of the image Used to enhanced low-contrast image Two methods: basic contrast stretching end-in search

34
Contoh Contrast Stretching

Presentasi serupa


 WILDAN ANUGERAH ( )>")


 POLIO 2016>")


