Upload presentasi
Presentasi sedang didownload. Silahkan tunggu

1
www.trend-traders.com Module 3 All About MT4, Support resistance, Fibonacci www.trend-traders.com TRADING COURSE

2
www.metaquotes.net Free historical & online streaming data (FOREX, Commodites, Stodex, etc) Adding custom indicator Scripting Backtesting & Forward Testing (automatic trading)
 Adding custom indicator Scripting Backtesting & Forward Testing (automatic trading)")
3
Tampilan Depan MT 4

4
Download Historical data Masuk ke Tools Option Charts (atau Ctrl + O)
")
5
Download Historical data Ganti angka di max bar in hostory dan max bar in chart dengan angka 99999999999999999

6
Download Historical data Masuk ke Tools History Center (Atau Pencet F2)
")
7
Download Historical data Pilih currency yang diinginkan dan klik download

8
Import Custom Indicator/EA to MT4 Pilih Folder tempat file indicator disimpan (*.mq4 / *.ex4)
")
9
Import Custom Indicator/EA to MT4 Pilih indicator / EA yang diinginkan, kemudian klik kanan pilih “copy” atau pencet Ctrl + V

10
Import Custom Indicator/EA to MT4 Masuk ke start menu MT4 Metatrader, kemudian klik kanan dan pilih “properties”

11
Import Custom Indicator/EA to MT4 Klik “Find Target” dan anda akan menuju ke folder di mana MT4 diinstall

12
Import Custom Indicator/EA to MT4 Posisi c:\Program Files\MT4

13
Import Custom Indicator/EA to MT4 Pilih folder Expert File Custom indicator dapat di paste di folder Expert/indicators Sedang file Robot /EA (expert advisor) cukup di paste di folder expert
 cukup di paste di folder expert")
14
Strategy Tester Masuk ke tools Metaquotes Languages Editor (F4) Pilih File New
 Pilih File New")
15
Strategy Tester Plih Expert Advisor beri nama Dummy Finish

16
Strategy Tester Compile

17
Strategy Tester View Strategy Tester (Ctrl + R)
")
18
Reversal days

19
The two-day reversal

20
FOREX Time New York (buka 8pm sampai 5am). New York adalah platform forex terbesar kedua di dunia dan sangat dipantau oleh investor asing karena dolar US terlibat dalam 90% dari semua perdagangan. Pergerakan di New York Stock Exchange (NYSE) dapat memiliki efek langsung pada dolar. Ketika perusahaan gabungan dan akuisisi tersebut selesai, maka dolar dapat memperoleh keuntungan atau kerugian nilai seketika. Tokyo (buka 7am sampai 6pm). Tokyo membawa pengaruh terbesar pada perdagangan di Asia, selain Hong Kong dan Singapura. Ini adalah pusat perdagangan pertama Asia yang dibuka. Pasangan mata uang terbaik yang menjadi sasaran adalah USD/JPY, GBP/CHF dan GBP/JPY. USD/JPY adalah pasangan yang baik untuk diperhatikan ketika pasar Tokyo satu-satunya pasar yang dibuka karena pengaruh besar dari Bank Jepang pada pasar. Sydney (buka 5am sampai 2pm). Sydney adalah waktu perdagangan yang dimulai sebagai pasar terkecil dari pasar besar, akan terlihat banyak sekali aksi awal ketika pasar dibuka kembali pada hari Minggu sore karena setiap pelaku pasar dan lembaga keuangan mencoba untuk menstabilkan harga setelah aksi yang terjadi sejak Jumat sore. London (buka 3pm sampai 11pm). Inggris mendominasi pasar mata uang di seluruh dunia, dan London adalah komponen utama. London, dikenal sebagai ibu kota perdagangan dunia, menyumbang sekitar 34% dari perdagangan global, menurut laporan dari IFS London. Kota ini juga memiliki dampak besar pada fluktuasi mata uang karena Bank Inggris yang menetapkan suku bunga dan mengendalikan kebijakan moneter dari GBP. Forex berasal dari London, yang merupakan hal teknis yang perlu diingat para pelaku pasar. www.trend-traders.com
 dapat memiliki efek langsung pada dolar. Ketika perusahaan gabungan dan akuisisi tersebut selesai, maka dolar dapat memperoleh keuntungan atau kerugian nilai seketika. Tokyo (buka 7am sampai 6pm). Tokyo membawa pengaruh terbesar pada perdagangan di Asia, selain Hong Kong dan Singapura. Ini adalah pusat perdagangan pertama Asia yang dibuka. Pasangan mata uang terbaik yang menjadi sasaran adalah USD/JPY, GBP/CHF dan GBP/JPY. USD/JPY adalah pasangan yang baik untuk diperhatikan ketika pasar Tokyo satu-satunya pasar yang dibuka karena pengaruh besar dari Bank Jepang pada pasar. Sydney (buka 5am sampai 2pm). Sydney adalah waktu perdagangan yang dimulai sebagai pasar terkecil dari pasar besar, akan terlihat banyak sekali aksi awal ketika pasar dibuka kembali pada hari Minggu sore karena setiap pelaku pasar dan lembaga keuangan mencoba untuk menstabilkan harga setelah aksi yang terjadi sejak Jumat sore. London (buka 3pm sampai 11pm). Inggris mendominasi pasar mata uang di seluruh dunia, dan London adalah komponen utama. London, dikenal sebagai ibu kota perdagangan dunia, menyumbang sekitar 34% dari perdagangan global, menurut laporan dari IFS London. Kota ini juga memiliki dampak besar pada fluktuasi mata uang karena Bank Inggris yang menetapkan suku bunga dan mengendalikan kebijakan moneter dari GBP. Forex berasal dari London, yang merupakan hal teknis yang perlu diingat para pelaku pasar.")
21
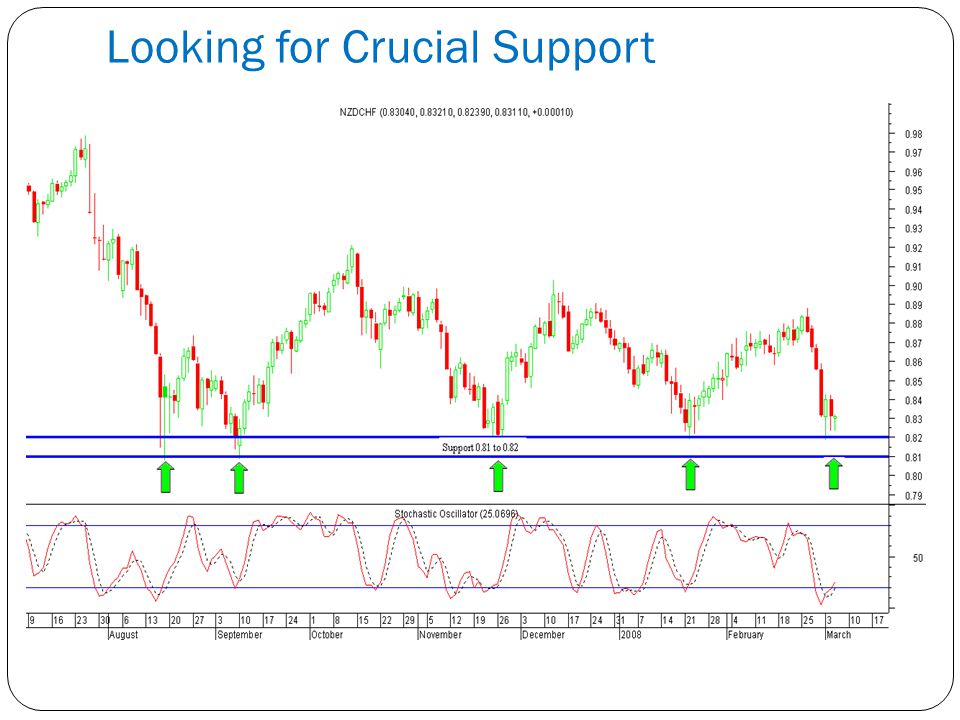
What is Support Support is the price level at which demand is thought to be strong enough to prevent the price from declining further. The logic dictates that as the price declines towards support and gets cheaper, buyers become more inclined to buy and sellers become less inclined to sell. By the time the price reaches the support level, it is believed that demand will overcome supply and prevent the price from falling below support.

22
Looking for Crucial Support

24
What is Resistance Resistance is the price level at which selling is thought to be strong enough to prevent the price from rising further. The logic dictates that as the price advances towards resistance, sellers become more inclined to sell and buyers become less inclined to buy. By the time the price reaches the resistance level, it is believed that supply will overcome demand and prevent the price from rising above resistance.

25
More Example on Resistance

26
Properties of Valid Support and Resistance The Support and Resistance should not be broken for at least for 1 month period.

27
Number of Touches The more number of touches the more the Valid Support/Resistance

28
Number of Touches

29
Why Resistance becomes support Trader 1 : Trader is going Short at Crude oil at MCX @ 3870-3900 and was having fun seeing the prices fall down.

30
Resistance becoming Support Trader 2 : Very Happy Buying MCX Crude @ 3400-3450 and selling at 3900

31
Resistance becomes the Support Now the Market Break out of the Resistance Zone and AS USUAL TRADERS WILL NOT PUT THEIR STOP LOSSE IN PLACE and they will be worried and sad to cover their position. Turns buyer at Break even.

32
Resistance becomes the Support Longs are happy but sad because they did not bought more so after break out near Previous Resistance they add more position

33
Resistance becomes the Support Then there were Guys like me who were just waiting for breakout to happen once it is in place we will try to Buy Market at Near new Support Level

34
Support Becomes Resistance

35
What is Fibonacci number Na…………………………………………………………..

36
What is Fibonacci Number The Fibonacci number sequence (1,2,3,5,8,13,21,34,55,89,144,...) is constructed by adding the first two numbers to arrive at the third. The ratio of any number to the next number is 61.8 percent, which is a popular Fibonacci retracement number. The inverse of 61.8 percent is 38.2 percent, also used as a Fibonacci retracement number.

37
Fibonacci Retracement 25%, 38.2% 50% 61.8% 100% are the commonly used Retracements.

38
Fibonacci Retracement

39
Expansions - Extensions When a rebound from retracement of a previous trend exceeds the previous high (in an uptrend) or low (in a downtrend), erase the old retracements and apply extensions.
 or low (in a downtrend), erase the old retracements and apply extensions.")
40
Expansions - Extensions

41
Plotting Fibonacci Expansion For plotting the Fibonacci Expansions you need 3 points, and the basic technique for an uptrend, is to plot it off a Low, and High and a Higher Low (or for down trends - a High, a Low and a Lower High).
.")
42
Plotting Fibonacci Expansion We measure the distance from Point A to Point B. However, we can’t project price targets until Point C has been established. Only when Point C has been formed do we have the necessary three swing points. In short, we identify a trend that has started and pulled back, forming Points A and B, and wait for Point C to form. Once Point C has formed, we plot the Fibonacci Expansion Tool on Point A, Point B, and Point C.

43
Fibonacci Multipliers Application Assume B-A =.382 Multiplier of.382 = 2.618 If B-A = 100 points, then the target becomes 261.8 Add 261.8 to A The target is very aggressive B C A

44
Extend Retracement from Pullback C to D = (B – A) *.618 or 1 or 1.618 Long-term targets A A B B D D C C
 *.618 or 1 or Long-term targets A A B B D D C C")
Presentasi serupa
. What is BPOS? Apakah BPOS itu? •BPOS = (Microsoft) Business Productivity Online Suite (Service) •adalah sebuah layanan online Microsoft,>")
. What is BPOS? Apakah BPOS itu? •BPOS = (Microsoft) Business Productivity Online Suite (Service) •adalah sebuah.>")


>")


