Upload presentasi
Presentasi sedang didownload. Silahkan tunggu

1
MEAN, MEDIAN, MODE

2
How to make it? FREQUENCY DISTRIBUTION TABLE
A table containing array data have been grouped by class or specific categories . How to make it? 2

3
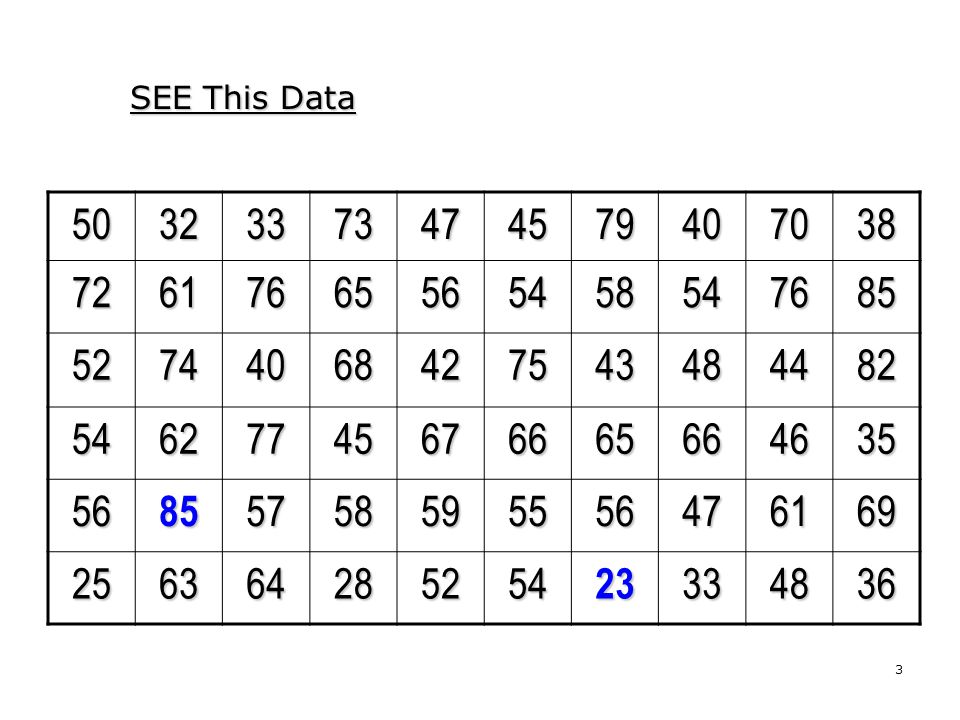
SEE This Data 50 32 33 73 47 45 79 40 70 38 72 61 76 65 56 54 58 85 52 74 68 42 75 43 48 44 82 62 77 67 66 46 35 57 59 55 69 25 63 64 28 23 36 3
4
FIRST STEPS ARE MAKE A FREQUENCY DISTRIBUTION TABLE
4

5
JK = 1 + 3,322 log n STEP 01 : SET NUMBER OF CLASSES (Jumlah Kelas JK)
H.A. Sturges (1926) JK = number of classes n = the number of observations (data) 5
 JK = number of classes. n = the number of observations (data) 5.")
6
Form the data, number of classes are
JK = 1 + 3,322 log 60 = 1 + 3,322 (1,778) = 1 + 5,907 = 6,907 ≈ 7 class 6
 = 1 + 5,907. = 6,907 ≈ 7 class. 6.")
7
Set class interval ( Interval Kelas IK)
STEP 02 : Set class interval ( Interval Kelas IK) (Xt – Xr) IK = JK Dimana : IK = class inteval Xt = highest data Xr = lower data Xt – Xr = Range 7
 (Xt – Xr) IK = JK. Dimana : IK = class inteval. Xt = highest data. Xr = lower data. Xt – Xr = Range. 7.")
8
From the data obtained Xt = 85 and Xr = 23, then IK = ....?
(Xt – Xr) IK = JK (85 – 23) IK = 7 = 8,8 ≈ 8 8
 IK = JK. (85 – 23) IK = 7. = 8,8 ≈")
9
The frequency table is :
Class interval Tally Frequency ( f ) 23 – 31 Ill 3 32 – 40 llll llll 8 41 – 49 IIII IIII II 10 50 – 58 IIII IIII IIII II 14 59 – 67 IIII IIII III 11 68 – 76 IIII IIII 77 – 85 IIII II 6 total 60 9
 23 – 31. Ill – 40. llll llll – 49. IIII IIII II – 58. IIII IIII IIII II – 67. IIII IIII III – 76. IIII IIII. 77 – 85. IIII II. 6. total")
10
WHAT YOU NEED TO KNOW FROM THE FREQUENCY DISTRIBUTION TABLE
10

11
(Class Limit) lowest possible values within a class interval. Example
Lower Class Limit lowest possible values within a class interval. Example In the class interval : 20-29; 30-39; 40-49 the lower class limit are 20, 30, dan 40. Upper Class Limit highest possible values within a class interval Example In the class interval ; 30-39; 40-49 The highest class limit 29, 39, dan 49. 11

12
Class Boundaries Lower Class Boundary
The real lower class boundary LCB – 0,5 Ex : Class interval 20-29; 30-39; 40-49, the LCB 19,5; 29,5; dan 39,5. Upper Class Boundary The real upper class boundary UCL+ 0,5 Ex : Class interval 20-29; 30-39; 40-49, the UCB 29,5; 39,5; dan 49,5. 12

13
Mid-point or class mark
Mid-point ith = (LCL + UCL) : 2 Dimana : MP I = Mid point class ith (1,2,3,4,…..i) LCL = Lowe class limit UCL = Upper class limit 13
 : 2. Dimana : MP I = Mid point class ith (1,2,3,4,…..i) LCL = Lowe class limit. UCL = Upper class limit. 13.")
14
Mid point for class interval on Table 5.1 :
23 – 31 3 27 32 – 40 8 36 41 – 49 10 45 50 – 58 14 …… 59 – 67 11 68 – 76 77 – 85 6 total 60 14

15
Cummulative Frequency
Cf : frequencies results from the merger of the class frequency with the class freqency before Cf can be calculated based on : ≤ (equal to or less than) ≥ (equal to or more than) 15
 ≥ (equal to or more than) 15.")
16
Comulative frequency for Table 5.1 :
Class interval f Mid point Cf ( ≤ ) ( ≥ ) 23 – 31 3 27 32 – 40 8 36 11 41 – 49 10 45 21 50 – 58 14 54 dst 59 – 67 63 25 68 – 76 72 77 – 85 6 81 total 60 16
 ( ≥ ) 23 – – – – dst. 59 – – – total")
17
presented in graphical is certainly interesting
17

18
Polygon:…use frequency and mid point
20 15 10 5 Mid point 27 36 45 54 63 72 81 18

19
Histogram:…use freq and lower class boundary
frequency HISTOGRAM 20 15 10 5 LCB 22,5 31,5 40,5 49,5 58,5 67,5 76,5 85,5 19

20
Ogive:…use cummulaive freq dan
lower class boundary Cf 60 Less than OGIVE 20 more than 5 Lower class boundary 22,5 31,5 40,5 49,5 58,5 67,5 76,5 20

21
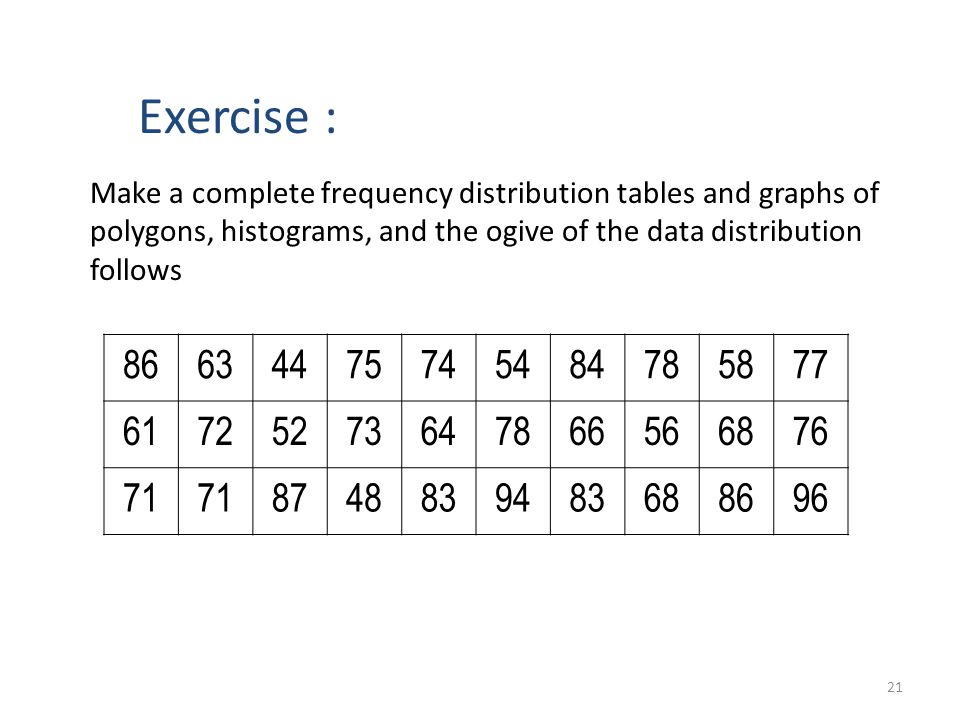
Exercise : Make a complete frequency distribution tables and graphs of polygons, histograms, and the ogive of the data distribution follows 86 63 44 75 74 54 84 78 58 77 61 72 52 73 64 66 56 68 76 71 87 48 83 94 96
22
Apa yang dimaksud UKURAN PEMUSATAN ? Ukuran nilai pusat yaitu nilai
yang mewakili suatu deretan/ rangkaian/gugusan data Ukuran Pemusatan mencakup : MEAN, MEDIAN,dan MODUS 22

23
Data Tidak Dikelompokkan
MEAN, MEDIAN, MODUS Data Tidak Dikelompokkan

24
MEAN (Me) ---- rata-rata hitung
Diperoleh dengan menjumlahkan seluruh nilai data (x1+ x2 +…+ xi) dibagi dengan banyaknya data (n). Rata-rata hitung yang diambil dari data sampel dilambangkan dengan x bar = x x = Σ xi n i=1 x x1+x2+x3…xi n = atau
 dibagi dengan banyaknya data (n). Rata-rata hitung yang diambil dari data sampel. dilambangkan dengan x bar = x. x. = Σ xi. n. i=1. x. x1+x2+x3…xi. n. = atau.")
25
Contoh 6.1 : mean data tidak dikelompokkan
Mata Kuliah Nilai P.Statistik 10 Azas-azas Manajemen 8 Perilaku Organisasi 7 MSDM PPSDM 9 Matematika 6 Olah Raga Jumlah 54 Mean (54 : 7) = 7,7
 = 7,7.")
26
MEDIAN (Md) Nilai yang ada di tengah-tengah rangkaian data, setelah diurutkan dari data dengan nilai terkecil sampai terbesar. Letak Md data tidak dikelompokkan dicari dengan : LMd = (n + 1) : 2 n adalah banyaknya data
 : 2. n adalah banyaknya data.")
27
Nilai setelah diurutkan
Contoh 6.2 : Median data tidak dikelompokkan LMd = (7 + 1) : 2 = 4 (median terletak pada urutan data ke 4) Nilai Nilai setelah diurutkan Urutan 10 6 Pertama 8 7 Kedua Ketiga Keempat 9 .. n = 7 Nilai Md
 : 2. = 4 (median terletak pada urutan data ke 4) Nilai. Nilai setelah diurutkan. Urutan Pertama Kedua. Ketiga. Keempat n = 7. Nilai Md.")
28
Bagaimana menentukan Md jika banyaknya data adalah genap ?
Nilai Nilai setelah diurutkan 10 6 8 7 9 LMd = (8 + 1) : 2 = 4,5 Median terletak pada data urutan ke 4,5 atau antara urutan ke 4 dan 5. Berapa Nilainya ? Md = (7 + 8) : 2 = 7,5
 : 2. = 4,5. Median terletak pada data urutan ke 4,5 atau antara urutan ke 4 dan 5. Berapa Nilainya Md = (7 + 8) : 2 = 7,5.")
Presentasi serupa


>")


