Upload presentasi
Presentasi sedang didownload. Silahkan tunggu

1
DIPRESENTASIKAN OLEH FITRIANY
CG IN EAST ASIA DIPRESENTASIKAN OLEH FITRIANY

2
CG IN EAST ASIA A Cross-Firm Analysis of the Impact of Corporate Governance on the East Asian Financial Crisis, Todd Mitton EXPROPRIATION OF MINORITY SHAREHOLDERS IN EAST ASIA, DES 99 Stijn Claessens, Simeon Djankov, Joseph P.H. Fan, and Larry H.P Lang Who Controls East Asian Corporations? Stijn Claessens, Simeon Djankov, and Larry H.P. Lang

3
1. A Cross-Firm Analysis of the Impact of CG on the East Asian Financial Crisis
Penelitian ini ingin menguji dampak CG terhadap kinerja perusahaan selama krisis, dengan menggunakan data firm-level dari lima negara Asia Timur yaitu Indonesia, Korea, Malaysia, Philipina, dan Thailand. Paper ini mempertimbangkan adanya karakteristik perusahaan yang berkaitan dengan CG (disclosure quality, ownership structure, dan corporate diversification) dapat membantu melindungi expropriation dan menjaga firms value selama krisis
 dapat membantu melindungi expropriation dan menjaga firms value selama krisis.")
4
1. A Cross-Firm Analysis of the Impact of CG on the East Asian Financial Crisis-Hasil
1. Perlindungan hukum untuk minority s/h mrpk elemen kunci CG 2. Perusahan yang memiliki : kualitas disclosurenya tinggi, lebih transparan, struktur ownership lebih favorable dan lebih fokus pada organisasi memberikan perlindungan yang lebih besar thd minority s/h selama krisis keuangan di Asia Timur 3. Perusahaan-perusahaan seharusnya membangun landasan institusional yg kuat sebelum memasuki pasar modal asing

5
3. Results Model penelitian :

6
2. EXPROPRIATION OF MINORITY SHAREHOLDERS IN EAST ASIA
We examine the evidence on expropriation of minority shareholders in publicly-traded companies in East Asia, by studying separately the effects of cash-flow and voting rights of the controlling shareholder on market valuation.

7
2. EXPROPRIATION OF MINORITY SHAREHOLDERS IN EAST ASIA-HASIL
Higher cash-flow rights are associated with higher valuation,consistent with the findings of Jensen and Meckling (1976) for the effects of concentration of management control in the United States. In contrast, concentration of control rights has a negative effect on firm value, consistent with Morck et al. (1988) and Shleifer and Vishny (1997). Separation of voting from cash-flow rights (through the use of dual-class shares, pyramiding, and cross-holdings) is especially associated with lower market values. We conclude that the risk of expropriation is the major principal-agent problem for public corporations in East Asia.
 for the effects of concentration of management control in the United States. In contrast, concentration of control rights has a negative effect on firm value, consistent with Morck et al. (1988) and Shleifer and Vishny (1997). Separation of voting from cash-flow rights (through the use of dual-class shares, pyramiding, and cross-holdings) is especially associated with lower market values. We conclude that the risk of expropriation is the major principal-agent problem for public corporations in East Asia.")
8
3. Who Controls East Asian Corporations?
This study analyze the control pattern of companies by studying all ultimate shareholders who control over ten percent of the votes. Questions: Are there any differences in the patterns and distribution of control across the East Asian countries, including less developed ones? Are there within-country differences in the concentration and distribution of control? Do within-country differences depend on size or age of the corporation? To what extent is corporate control concentrated in the hands of particular families and is the relation between business and government very strong? If such differences in ultimate ownership exist across countries, what are their determinants?

9
3. Conclusions-Who Controls East Asian Corporations?
In most East Asian countries, wealth is very concentrated in the hands of few families and links between government and business are extensive. Legal and regulatory developments may have been impeded by the concentration of corporate wealth and the extensive links between corporations and government, either directly or indirectly.

10
3. Conclusions-Who Controls East Asian Corporations?
Insider-control may also have contributed to the weak performance and risky investment of many East Asian corporations prior to the crisis. The results allow for a reexamination of the relationships between ownership structure and corporate performance, since previous studies only looked at the immediate owners and not the ultimate control.

11
3. Conclusions-Who Controls East Asian Corporations?
This line of research may in turn offer several important insights as to how corporate governance and corporate restructuring in East Asia can be improved. Finally, the large role played by a few families in East Asian corporate sectors suggest that an investigation of the evolution of legal and judicial systems in relation to wealth concentration may be particularly insightful for some of these countries.

12
Cross-Country Differences in the Concentration of Control
Regression for the control structures on some simple proxies for firm- and country specific factors: CONTROLi = a + b1*log(Sizei) + b2*log (AGEi)+ b3*DEVIATEi + b4*MANAGERi + b5*PYRAMIDi + b6*log(GNP) + Country Dummies + Sector Dummies + uI CONTROL is the control stake of the largest ultimate owner of firm i, Size is the log-level of the share of market capitalization of firm i in total market capitalization within each country, AGE is log-level of the number of years since establishment of the firm. DEVIATE captures the firm-specific deviation from one-share-one-vote and is a discrete variable 1 if there are deviations between cash flow and control rights and 0 otherwise. MANAGER; dummies for companies where managers belong to the controlling families PYRAMID; where control is enhanced by pyramiding GNP;level of development of the country log-level of the per-capita GNP of that country in 1996.
 + b2*log (AGEi)+ b3*DEVIATEi + b4*MANAGERi + b5*PYRAMIDi + b6*log(GNP) + Country Dummies + Sector Dummies + uI. CONTROL is the control stake of the largest ultimate owner of firm i, Size is the log-level of the share of market capitalization of firm i in total market capitalization within each country, AGE is log-level of the number of years since establishment of the firm. DEVIATE captures the firm-specific deviation from one-share-one-vote and is a discrete variable 1 if there are deviations between cash flow and control rights and 0 otherwise. MANAGER; dummies for companies where managers belong to the controlling families. PYRAMID; where control is enhanced by pyramiding. GNP;level of development of the country log-level of the per-capita GNP of that country in")
13
MITTON

14
CG menjadi lebih kritis dalam krisis keuangan karena
Introduction CG merupakan cara dimana minoriry s/h dilindungi dari expropriation manager atau controlling s/h CG menjadi lebih kritis dalam krisis keuangan karena Expropriation minority s/h menjadi lebih keras selama periode krisis. JBBF(2000): krisis dapat mengarahkan expropriation yang lebih besar karena manajer akan lebih banyak melakukan exproriate akibat return yang diharapkan turun.
: krisis dapat mengarahkan expropriation yang lebih besar karena manajer akan lebih banyak melakukan exproriate akibat return yang diharapkan turun.")
15
Introduction Krisis dapat mendorong investor untuk mengakui dan mengambil kelemahan CG yang terus terjadi, sehingga perusahaan dengan CG yang lemah relatif lebih banyak kehilangan valuenya selama krisis. Rajan & Zingales (1998): investors ignored weakness of EA firms when doing well, but quickly pulled out on crisis, since lacked protection for their investments.
: investors ignored weakness of EA firms when doing well, but quickly pulled out on crisis, since lacked protection for their investments.")
16
Introduction Bukti dari krisis di Asia Timur menunjukkan bahwa expropriation of minority s/h dilindungi. Nov 1997, Malaysia (UEM) memperoleh 32.6% dari induknya yang mengalami masalah keuangan, sehingga harga saham jatuh 38% saat transaksi diumumkan. Korea: minority s/h Samsung electronics protes karena perusahaan memberikan jaminan hutang kepada grup yang kurang sukses dan jaminan tersebut tidak didisclose. Paper ini mempertimbangkan adanya karakteristik perusahaan yang berkaitan dengan CG (disclosure quality, ownership structure, dan corporate diversification) dapat membantu melindungi expropriation dan menjaga firms value selama krisis
 memperoleh 32.6% dari induknya yang mengalami masalah keuangan, sehingga harga saham jatuh 38% saat transaksi diumumkan. Korea: minority s/h Samsung electronics protes karena perusahaan memberikan jaminan hutang kepada grup yang kurang sukses dan jaminan tersebut tidak didisclose. Paper ini mempertimbangkan adanya karakteristik perusahaan yang berkaitan dengan CG (disclosure quality, ownership structure, dan corporate diversification) dapat membantu melindungi expropriation dan menjaga firms value selama krisis.")
17
1. DISCLOSURE QUALITY Diukur dengan 2 cara :
Perusahaan mempunyai kualitas disclosure lebih tinggi jika perusahaan listed di American depository receipt (ADR) karena secara formal harus memenuhi disclosure yang mandatory dan secara informal banyak investor yang menuntut disclosure yang lebih baik dan melakukan analisa atas laporan keuangan perusahaan. Perusahaan mempunyai kualitas disklosur jika auditornya adalah salah satu dari Big Six. Karena lebih transparan dan sedikit kesalahan, reputasi lebih baik, dan lebih independen karena mereka menghadapi legal liability yang lebih besar jika membuat kesalan (Dye, 1993). Semakin baik kualitas disclosure, kinerja saham semakin baik selama periode krisis . Jika perusahaan having ADR higher return of 10.8%, Jika perusahaan having Big Six Auditor higher return 8.1% Semakin baik disclosure quality, akan memberi manfaat bagi minority shareholders Dimana terjadi peningkatan transparansi dan mengurangi expropriation selama periode distress.
 karena secara formal harus memenuhi disclosure yang mandatory dan secara informal banyak investor yang menuntut disclosure yang lebih baik dan melakukan analisa atas laporan keuangan perusahaan. Perusahaan mempunyai kualitas disklosur jika auditornya adalah salah satu dari Big Six. Karena lebih transparan dan sedikit kesalahan, reputasi lebih baik, dan lebih independen karena mereka menghadapi legal liability yang lebih besar jika membuat kesalan (Dye, 1993). Semakin baik kualitas disclosure, kinerja saham semakin baik selama periode krisis . Jika perusahaan having ADR higher return of 10.8%, Jika perusahaan having Big Six Auditor higher return 8.1% Semakin baik disclosure quality, akan memberi manfaat bagi minority shareholders. Dimana terjadi peningkatan transparansi dan mengurangi expropriation selama. periode distress.")
18
large s/h juga dapat menjadi pihak yang melakukan expropriation.
2. OWNERSHIP STRUCTURE Shleifer & Vishny(1997): ownership concentration dan legal protection adalah kunci yang menentukan CG perusahaan. Large s/h dapat membantu minority s/h karena punya power dan insentif untuk melindungi expropriation, tetapi disisi lain large s/h juga dapat menjadi pihak yang melakukan expropriation. LLS(1999) : tingkat konsentrasi kepemilikan yang tinggi pada perusahaan yang s/h protectionnya rendah,dan konflik antara large s/h dan minority s/h adalah pada masalah CG.
: ownership concentration dan legal protection adalah kunci yang menentukan CG perusahaan. Large s/h dapat membantu minority s/h karena punya power dan insentif untuk melindungi expropriation, tetapi disisi lain. large s/h juga dapat menjadi pihak yang melakukan expropriation. LLS(1999) : tingkat konsentrasi kepemilikan yang tinggi pada perusahaan yang s/h protectionnya rendah,dan konflik antara large s/h dan minority s/h adalah pada masalah CG.")
19
2. OWNERSHIP STRUCTURE Large shareholders could be more likely to pursue objectives that are inconsistent with those of minority shareholders if : they are involved with management of the firm or if their voting rights exceed their cash flow rights (Claessens et al., 2000). Return premium berhubungan dengan higher ownership concentration lebih berhubungan dengan large blockholders yang tidak terlibat management. Firms in which : the largest shareholders’ voting rights exceed their cash flow rights and firms with pyramidal ownership structures have significantly lower returns, meskipun signifikansinya menghilang setelah dikontrol dengan faktor lain.
. Return premium berhubungan dengan higher ownership concentration lebih berhubungan dengan large blockholders yang tidak terlibat management. Firms in which : the largest shareholders’ voting rights exceed their cash flow rights and. firms with pyramidal ownership structures. have significantly lower returns, meskipun signifikansinya menghilang setelah dikontrol dengan faktor lain.")
20
3. CORPPORATE DIVERSIFICATION
Corp Diversf bukan merupakan mekanisme CG tetapi riset sblmnya menyatakan bahwa agency problem berbeda pada diversified firms. Lower transparency dari diversified firms pada emerging markets higher level of asymmetric information memungkinkan managers or controlling s/h mengambil keuntungan dari minority s/h. Diversivikasi dapat memberi benefit dengan meningkatnya capital allocation (terutama dinegara berkembang), tapi benefit ini bisa hilang pada masa krisis karena kesempatan investasi menurun.
, tapi benefit ini bisa hilang pada masa krisis karena kesempatan investasi menurun.")
21
3. CORPPORATE DIVERSIFICATION
Corporate diversivication berhubungan signifikan dengan memburuknya kinerja saham selama krisis. Secara rata-rata, diversified firms memiliki lower returns of 7.6% selama periode krisis (after controllingfor size, leverage, country, and industry) loss in value untuk diversified firms selalu dihubungkan dengan diversified firms yang memiliki high variation dalam investment opportunities across divisions.
 loss in value untuk diversified firms selalu dihubungkan dengan diversified firms yang memiliki high variation dalam investment opportunities across divisions.")
22
Data dan Metodologi Sample selection
5 negara Asia Timur yang digunakan sebagai sampel adalah : Indonesia, Korea, Malaysia, Philipina, dan Thailand. Lima neg ini yang paling menderita dalam pasar modal dan depr.mata uang

23
Data dan Metodologi Sample selection
5 negara Asia Timur yang yang paling menderita dalam pasar modal dan depr.mata uang : Indonesia, Korea, Malaysia, Philipina, dan Thailand. Kriteria Sampel : Mempunyai data keuangan di Wordscope database Bukan perusahaan financial services Termasuk dalam International Finance Corporation (IFC) global index. Final Sampel = 398 firms dari lima negara.
 global index. Final Sampel = 398 firms dari lima negara.")
24
Tabel 1

25
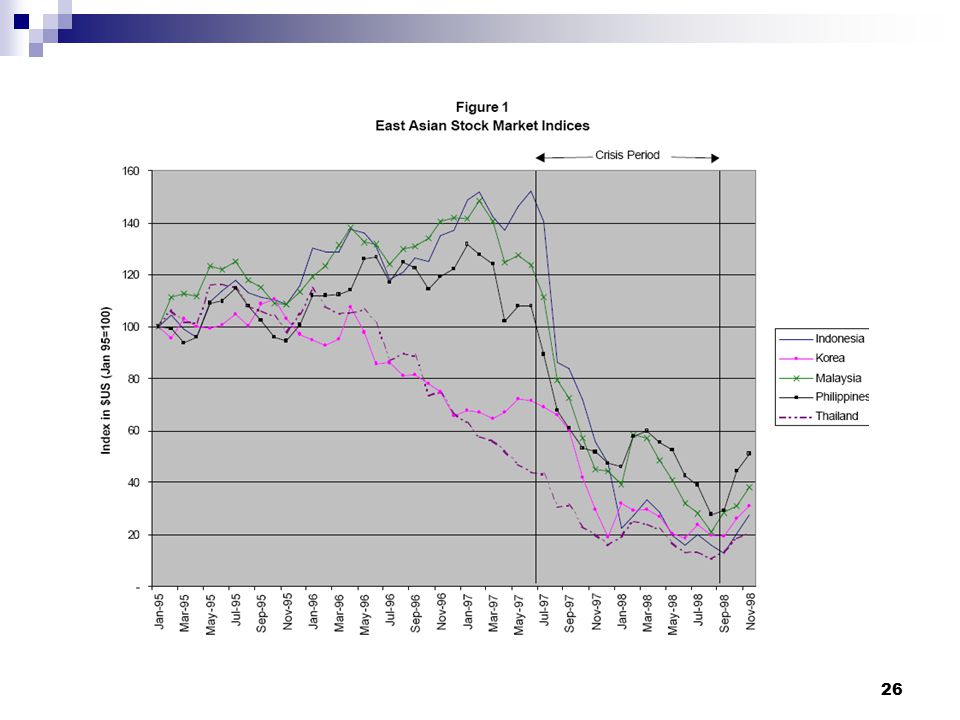
Definition of Crisis Period
Fig.1 menunjukkan pergerakan index saham komposit untuk lima negara tahun Periode krisis dimulai 2 Juli 1997 bersamaan dengan devaluasi baht Thai, dan penurunan index saham secara bersama oleh kelima negara, sampai Agustus 1999

27
Variable Descriptions
Dependent Variable Firm performance : returns saham selama periode krisis; termasuk dividend, yang dinyatakan dalam local currency diadjust dengan perubahan index harga lokal. Tidak menggunakan abnormal returns dengan beta historis karena keterbatasan data; Variabel kontrol: leverage, size, industry dummy, country dummy (lihat tabel 1)
")
28
Variable Descriptions
Explanatory variable Disclosure quality ADR dan Big Six Ownership concentration Semua pihak yang kepemilikannya 5% atau lebih setiap perusahaan Corporate diversification Ditentukan oleh jumlah industri dimana setiap perusahaan beroperasi (dua digit SIC level)
")
29
Variable Descriptions
Disclosure quality ADR : dummy variabel dengan angka 1 jika perusahaan listed di US dimulai krisis, 0 lainnya BigSix: dummy; 1 jika perusahaan diaudit oleh salah satu Big Six internasional, 0 lainnya

30
Variable Descriptions
Ownership concentration Pihak yang memiliki 5% atau lebih dari setiap perusahaan dengan 2 ukuran : 1. Large blockholder concentration (% kepemilikan dari largerst s/h ) 2. Summed ownership concentration (total holding of s/h yang memiliki 5% atau lebih saham)
 2. Summed ownership concentration. (total holding of s/h yang memiliki 5% atau lebih saham)")
31
Variable Descriptions
Corporate diversification Ada 2 variabel diversification : - Indikator multiple segment, dummy var, 0: jika 90% atau lebih penjualan perusahaan berasal dari satu 2-digit SIC, 1 lainnya - Jml industri dimana perusahaan beroperasi

32
Variable Descriptions
Control variable Firm size = log Total Assets atau net sales (bervariasi antar negara) Debt ratio = BV of total debt dibagi PV total capital Country = dummy variables (4 dari 5 negara) Industri = dummy variabel untuk 10 dari 11 industri
 Debt ratio = BV of total debt dibagi PV total capital. Country = dummy variables (4 dari 5 negara) Industri = dummy variabel untuk 10 dari 11 industri.")
33
3. Results Model penelitian :

34
3. Disclosure Quality & Firm Performance
Tabel 2 menunjukkan hasil regresi return saham terhadap disclosure quality (kolom vi) ADR jika control variabel dimasukkan dalam model , rata2, menghasilkan return yang lebih tinggi 10.8% selama periode krisis BigSix auditor, rata2, menaikkan return lebih tinggi 8.1% selama periode krisis
 ADR jika control variabel dimasukkan dalam model , rata2, menghasilkan return yang lebih tinggi 10.8% selama periode krisis. BigSix auditor, rata2, menaikkan return lebih tinggi 8.1% selama periode krisis.")
35
Tabel 2

36
Ownership Structure & Firm Performance
Panel A Tabel 3 Jika variabel kontrol dimasukkan, Koefisien largest blockholder concentration sebesar 0.261, artinya setiap ada kenaikan ownership concentration 10% akan meningkatkan return sebesar 2.6% selama krisis (kolom ii) Jika variabel kontrol dimasukkan, Koefisien summed ownership concentration sebesar 0.174, artinya jika terdapat kenaikan ownership concentration 10%, maka return akan naik sebesar 1.7% (kolom iv)
 Jika variabel kontrol dimasukkan, Koefisien summed ownership concentration sebesar 0.174, artinya jika terdapat kenaikan ownership concentration 10%, maka return akan naik sebesar 1.7% (kolom iv)")
37
Panel A Tabel 3

38
Ownership Structure & Firm Performance
Panel B Tabel 3 Koef. Mgt blockholding adalah positif jika semua var kontrol dimasukkan, tetapi tidak signifikan untuk semua model. Koef. Non-mgt blockholding lebih tinggi dan sign pada 1% Perbedaan koef. tsb menunjukkan bhw nilai large blockholder lebih besar selama krisis jika blockholder tidak terlibat dalam manajemen Hasil ini konsisten dengan ide bahwa jika blockholder terlibat dalam mgt, mereka punya kesempatan lebih atau insentif untuk expropriation minority s/h.

39
Panel B Tabel 3

40
Ownership Structure & Firm Performance
Panel C Tabel 3 Membedakan cash flow rights dan voting rights untuk largest s/h Menggunakan data Classens et al. (2000) dengan sampel 311 Kolom (i) dan (ii) : koef. Voting rights lebih tinggi tetapi 2 koef sama besarannya dan signifikan. Kolom (iii) dan (iv): dummy variabel 1 jika prshn mempunyai divergence antara cash flow rights dan voting rights
 dengan sampel 311. Kolom (i) dan (ii) : koef. Voting rights lebih tinggi tetapi 2 koef sama besarannya dan signifikan. Kolom (iii) dan (iv): dummy variabel 1 jika prshn mempunyai divergence antara cash flow rights dan voting rights.")
41
Panel C Tabel 3

42
Ownership Structure & Firm Performance
Panel C Tabel 3 Konsisten dengan ide bhw divergence cash flows dan voting rights meningkatkan expropriation, koef variabel negatif, namun tidak signifikan saat semua variabel kontrol dimasukkan Kolom (v) dan (vi) : dummy variable, 1 jk persh mempunyai struktur kepemilikan pyramid. Koef neg, tetapi signifikan jika var kontrol tidak dimasukkan => jika struktur piramida, meningkatkan kemungkinan terjadinya ekspropriasi minority s/h
 dan (vi) : dummy variable, 1 jk persh mempunyai struktur kepemilikan pyramid. Koef neg, tetapi signifikan jika var kontrol tidak dimasukkan => jika struktur piramida, meningkatkan kemungkinan terjadinya ekspropriasi minority s/h.")
44
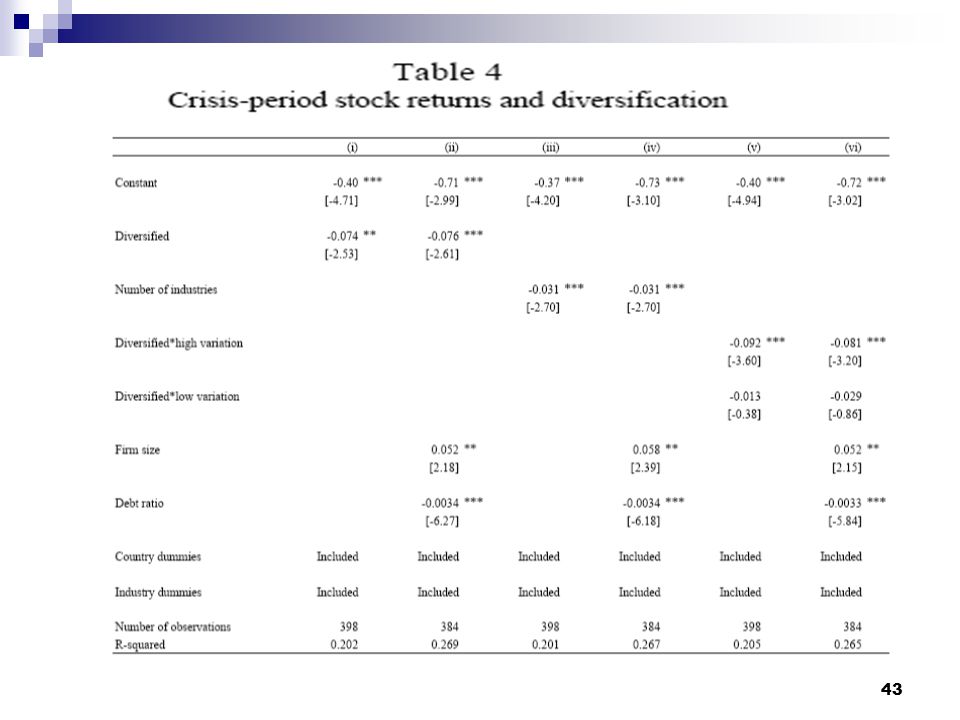
Corporate Diversification & Firm Performance
Tabel 4: Hasil regresi stock return terhadap variabel diversifikasi pada saat krisis Kolom (i) dan (ii) memasukkan indikator diversifikasi (dgn dan tanpa var kontrol size dan leverage) Kolom (ii), koef diversified : diversified firm menurunkan return 7.6% selama periode krisis Kolom (iii)dan (iv) menggambarkan jml industri per prshn, koef jg neg signifikan.
 dan (ii) memasukkan indikator diversifikasi (dgn dan tanpa var kontrol size dan leverage) Kolom (ii), koef diversified : diversified firm menurunkan return 7.6% selama periode krisis. Kolom (iii)dan (iv) menggambarkan jml industri per prshn, koef jg neg signifikan.")
45
Corporate Diversification & Firm Performance
Tabel 4: Hasil ini konsisten dengan hipotesis bhw kurangnya transparansi diversified firm meningkatkan kesempatan expropriation minority s/h Kolom (v) dan (vi) : membedakan antara diversified firm yang memiliki tingkat variasi dalam investment opportunity yang high dan low => menunjukkan koef.negatif lebih kuat jika perusahaan memiliki variasi investasi yang tinggi. IOS pakai tobins Q. Konsisten dgn hipotesis bhw prshn2 kehilangan nilai jika segmen2 yang relatif stabil digunakan secara tidak efisien untuk membantu segmen2 yang terkena krisis.
 dan (vi) : membedakan antara diversified firm yang memiliki tingkat variasi dalam investment opportunity yang high dan low => menunjukkan koef.negatif lebih kuat jika perusahaan memiliki variasi investasi yang tinggi. IOS pakai tobins Q. Konsisten dgn hipotesis bhw prshn2 kehilangan nilai jika segmen2 yang relatif stabil digunakan secara tidak efisien untuk membantu segmen2 yang terkena krisis.")
46
Robustness and alternative interpretation
Tabel 5: Hasil regresi tambahan untuk robustness test: Panel A semua variabel tidak diubah tdpt sedikit collinearity. Variabel disclosure quality, ownership,dan diversification mengalami perubahan sedikit dalam magnitude dan masih sign, kecuali Big Six tidak signifikan dlm reduced sample Panel B mengubah periode krisis dimulai mei 1996magnitude utk bbrp koef. Menurun, semua var. kunci masih sign.

47
Robustness and alternative interpretation Tabel 5
Panel C menggunakan returns dalam US. Dollar, hasilnya robust, magnitude koef.menurun tetapi masih signifikan. Panel D menngunakan pendekatan instrumental variable, dengan ownership stucture menggunakan data 1994 atas persentase largest blockholders, hasilnya masih sama

48
Tabel 5

49
Tabel 6 : hasil regresi variabel CG terhadap returns untuk two pre-crisis years
Panel A : Pre-crisis 1: July 1995 – Juni 1996 Panel B : Pre-crisis 2: July 1996 – Juni 1997 Panel C : Post-crisis: Sept 1998 –Agust 1999

50
Tabel 6

51
Firm performance following the crisis
Tabel 6 Panel A dan B: Var CG memiliki explanatory power yang kecil thd returns pershn sblm krisis.Panel C setelah krisis, maka Koef. Variabel Disclosure quality dan Diversification memiliki tanda yang berlawanan dalam periode krisis (hanya ADR yang sign). Reversal of Sign jika prshn dgn governance yang lemah, pada periode krisis mengarah pada meningkatnya expropriation. Tindakan pershn dan institusi setelah krisis mengakui peran governance yang lemah dan perlu mengubah praktek governance.
. Reversal of Sign jika prshn dgn governance yang lemah, pada periode krisis mengarah pada meningkatnya expropriation. Tindakan pershn dan institusi setelah krisis mengakui peran governance yang lemah dan perlu mengubah praktek governance.")
52
Who Controls East Asian Corporations?
Stijn Claessens, Simeon Djankov, and Larry H.P. Lang

53
Introduction Much of the literature on the role and function of the modern firm is based on the assumption of the prevalence of widely dispersed ownership. Resulted in the notion that “the owner of industrial wealth is left a mere symbol of ownership”the control over companies is being transferred to professional managers Berle and Means (1932) : hampir setengah dari perusahaan besar American tidak memiliki single owner yang mengkontrol lebih dari 20% dari saham. also Baumol (1959), Jensen and Meckling (1976) and Grossman and Hart (1980)
 : hampir setengah dari perusahaan besar American tidak memiliki single owner yang mengkontrol lebih dari 20% dari saham. also Baumol (1959), Jensen and Meckling (1976) and Grossman and Hart (1980)")
54
Introduction Demsetz (1983), Shleifer and Vishny (1986), Morck, Shleifer, and Vishny (1988): some concentration of ownership and control exists even among the largest American corporations. La Porta et al. (1998): even larger concentration of control in a cross-section of developed and developing countries. La Porta, Lopez-de-Silanes, and Shleifer (1998) investigates the important issue of ultimate control. The concentration of ownership is enhanced through the use of pyramid structures, deviations from one-share-one-vote rules, cross-holdings, and the appointment of managers and directors who are related to the controlling family.
, Shleifer and Vishny (1986), Morck, Shleifer, and Vishny (1988): some concentration of ownership and control exists even among the largest American corporations. La Porta et al. (1998): even larger concentration of control in a cross-section of developed and developing countries. La Porta, Lopez-de-Silanes, and Shleifer (1998) investigates the important issue of ultimate control. The concentration of ownership is enhanced through the use of pyramid structures, deviations from one-share-one-vote rules, cross-holdings, and the appointment of managers and directors who are related to the controlling family.")
55
Previous Studies and the Gap
Fukuyama, 1996; Rajan and Zingales, (1998)East Asian corporations have already long been considered to be an exception to the notion of widely-held ownership La Porta, Lopez-de-Silanes, and Shleifer, 1998most developing and some developed countries have similar degree of ownership concentration. The degree to which ownership is concentrated in East Asian countries has, however, not been documented on a systematic, cross-country basis.
East Asian corporations have already long been considered to be an exception to the notion of widely-held ownership. La Porta, Lopez-de-Silanes, and Shleifer, 1998most developing and some developed countries have similar degree of ownership concentration. The degree to which ownership is concentrated in East Asian countries has, however, not been documented on a systematic, cross-country basis.")
56
Previous Studies and the Gap
Aoki, (1990); Nishiyama, (1984); Prowse, (1992); Hoshi, Kashyap, and Scharfstein, (1991); Kaplan, (1994) point to the significance of keiretsu groups in Japan; These studies focus on company performance, do not attempt to trace the ownership of each company to its ultimate owners and identify those owners by type and control stake. The exception is Lim (1981) who studies in detail the control structures of the largest hundred corporations in Malaysia, using the Berle and Means (1932) methodology.
; Nishiyama, (1984); Prowse, (1992); Hoshi, Kashyap, and Scharfstein, (1991); Kaplan, (1994) point to the significance of keiretsu groups in Japan; These studies focus on company performance, do not attempt to trace the ownership of each company to its ultimate owners and identify those owners by type and control stake. The exception is Lim (1981) who studies in detail the control structures of the largest hundred corporations in Malaysia, using the Berle and Means (1932) methodology.")
57
Previous Studies and the Gap
Case studies yang menjelaskan control structures dari the largest business groups in East Asian countries: Taylor (1992) for the Li Ka-shing group in Hong Kong Sato (1993) for the Salim group in Indonesia, Okumura (1993) for the Mitsubishi group in Japan, Taniura (1993) for the Lucky Goldstar group in Korea, Koike (1993) for the Ayala group in the Philippines, Numazaki (1993) for the Tainanbang group and Taniura (1989) for the Formosa group in Taiwan, Suehiro (1993) for the Charoen Pokphand group, and Vatikiotis (1997) for the Dhanin Chearavanont group in Thailand.
 for the Li Ka-shing group in Hong Kong. Sato (1993) for the Salim group in Indonesia, Okumura (1993) for the Mitsubishi group in Japan, Taniura (1993) for the Lucky Goldstar group in Korea, Koike (1993) for the Ayala group in the Philippines, Numazaki (1993) for the Tainanbang group and Taniura (1989) for the Formosa group in Taiwan, Suehiro (1993) for the Charoen Pokphand group, and Vatikiotis (1997) for the Dhanin Chearavanont group in Thailand.")
58
Previous Studies and the Gap
Penelitian tsb menyatakan bahwa dominasi dari sebagian besar grups karena memperoleh privileges dari government: exclusive exporting or importing rights, protection from foreign competition for extensive periods of time, including the granting of monopoly power in the local market, procurement of large government contracts, etc. Literature tersebut tidak melakukan cross-country comparisons, juga tidak mendokumentasikan mekanisme dimana the ultimate owners melakukan dan memperluas control mereka.

59
Control Structures in East Asia
La Porta et al. (1998) and La Porta, Lopez-de-Silanes, and Shleifer (1998) mendokumentasikan ownership structure dari 10 largest non-financial corporations dari 49 countries, termasuk 9 East Asian countries. Hasil : meskipun ownership concentration dari East Asian corporations tinggi, tidak berbeda secara significant dari negara lain yang memiliki tingkat perekonomian yang sama.
 and La Porta, Lopez-de-Silanes, and Shleifer (1998) mendokumentasikan ownership structure dari 10 largest non-financial corporations dari 49 countries, termasuk 9 East Asian countries. Hasil : meskipun ownership concentration dari East Asian corporations tinggi, tidak berbeda secara significant dari negara lain yang memiliki tingkat perekonomian yang sama.")
60
Control Structures in East Asia
La Porta, Lopez-de-Silanes, and Shleifer (1998) juga menguji alat untuk memperbesar control. Hasil penelitian menunjukkan bahwa owners memperbesar sumber dayanya melalui pyramiding and management appointments, misalnya melalui frequent cross ownership dan penggunaan (agak jarang) saham yang memiliki hak suara yang lebih banyak.
 juga menguji alat untuk memperbesar control. Hasil penelitian menunjukkan bahwa owners memperbesar sumber dayanya melalui pyramiding and management appointments, misalnya melalui frequent cross ownership dan penggunaan (agak jarang) saham yang memiliki hak suara yang lebih banyak.")
61
Data Worldscope database: memiliki data data perusahaan di 9 negara asia timur, tapi hanya 2,300 perusahaan yang memiliki info ownership yang detail. Supplement data from: the Asian Company Handbook 1999 (1998), the Japan Company Handbook 1999 (1998), the 1997 Annual Reports of the Hong Kong, Jakarta, Seoul, Kuala Lumpur, and Manila Stock Exchanges, Korean Fair Trade Commission, the Securities Exchange of Thailand Companies Handbook (1998), and the Singapore Investment Guide (1998).
, the Japan Company Handbook 1999 (1998), the 1997 Annual Reports of the Hong Kong, Jakarta, Seoul, Kuala Lumpur, and Manila Stock Exchanges, Korean Fair Trade Commission, the Securities Exchange of Thailand Companies Handbook (1998), and the Singapore Investment Guide (1998).")
62
Data The ownership structure as of December 1996 or the end of the 1996 accounting year. Exclude 852 companies that cannot be traced to a specific owner. End up with 2,980 publicly traded companies in 9 East Asian countries: Hong Kong, Indonesia, Japan, Korea (South), Malaysia, the Philippines, Singapore, Taiwan and Thailand.
, Malaysia, the Philippines, Singapore, Taiwan and Thailand.")
63
Table 1: Coverage of the Sample
*Main Board only

64
Methodology Use the methodology developed in La Porta, Lopez-de-Silanes, and Shleifer (1998) to investigate ultimate control patterns. 4 cut-off are used to analyze the control pattern of companies : 10%, 20%, 30%, and 40%. The four ownership cut-off levels are used for robustness purposes, compare the concentration of ownership across countries, size, and age of corporations. 20% cut-off is used as the benchmark.

65
Methodology XX definition of ownership relies on control rights, and not on cash flow rights. Suppose, for example, that a family owns 11% of the stock of publicly-traded Firm A, which in turn has 21% of the stock of Firm Bthe family controls 11% of Firm B - the weakest link in the chain of voting rights. In contrast, we would say that the family owns about 2% of the cash flow rights of Firm B. To make the distinction between cash-flow and control rights, we document deviations from one-share-one-vote rules and pyramiding structures for each firm.

66
Methodology The corporations are divided into
widely-held corporations with ultimate owners. A widely-held corporation : corporation which does not have any owners who have significant control rights. Ultimate owners : are further divided into 4 categories: Families; the state; widely-held financial institutions; and widely-held corporations. Formed a separate group for miscellaneous owners such as employee-stock ownership plans, managers not related to the controlling owners, and cooperatives. Since the number of such entities was very small (at most 1% of total ownership in the case of Japan), we pooled such ownership structures in the widely-held category.
, we pooled such ownership structures in the widely-held category.")
67
Methodology Ultimate control means a firm can have more than one significant owner. Firm C has three owners; a family, the state, and a widely-held corporation, each with 10% of voting right: firm is 1/3 controlled by each type of owner at the 10% level. At the 20% level, Firm C is widely-held as none of the three owners has 20% of the voting rights Firm D, has two owners, a family with 30% voting rights and a widely-held financial institution with 10% of the voting rights (the owner do not have equal shares of voting stock): At the 10% cut-off the family and the financial institution are assigned ½ each of ultimate control. At the 20% and 30% levels, defined to be 100% family-controlled and defined as widely-held at the 40% cut-off level.
: At the 10% cut-off the family and the financial institution are assigned ½ each of ultimate control. At the 20% and 30% levels, defined to be 100% family-controlled and defined as widely-held at the 40% cut-off level.")
68
Ultimate owners of Ayala corp.
Philippines Ultimate owners of Ayala corp. 3 Ultimate owners of Globe Telecom: Ayala Family 40%, ITT 32% and Meiji Life Insurance 23% 4 Ultimate owners of Automated Electronic at level 20%: IFC (USA) 20%, Japan Asia Inc.20%, Meiji Life Insurance 20%, and Ayala Family 30%
 20%, Japan Asia Inc.20%, Meiji Life Insurance 20%, and Ayala Family 30%")
69
Hong Kong: 25 comp. 2 Ultimate owners of Dao Heng Bank: Kwek Leng Chan 36% and Li Ka_Shing Family 12% 1 Ultimate owners of Hong Kong Electric: Li Ka_Shing Family 34%

70
Yasuda Life is the Ultimate owner of Nihon Cement with 39% = 13%+12%+14%
Yasuda Life is the Ultimate owner of Oki Electronic with 37% = 16%+7%+14%

71
Ultimate Control of East Asian Corporations: all four cut-off levels.
Tabel 2 This drop in family-control arises as many Japanese companies have family ownership between 10% and 20%. At a threshold of 20%, these corporations are defined as widely-held. The increase in family control is due to the definition of ultimate ownership

72
Table 3: Control of the Publicly Traded Companies in East Asia,
By Size (20% cut-off) In most countries, the share of family ownership increases for smaller-size firms, especially strong in Japan; Korean Taiwan; exception Hong Kong =1 =4 =48 these statistics show that the majority of large and medium-size Japanese and Korean corporations are widely-heldAll bottom fifty companies have ultimate owners. Much less variation of control structures across company size in the Philippines.
 In most countries, the share of family ownership increases for smaller-size firms, especially strong in Japan; Korean Taiwan; exception Hong Kong. =1. =4. =48. these statistics show that the majority of large and medium-size Japanese and Korean corporations are widely-heldAll bottom fifty companies have ultimate owners. Much less variation of control structures across company size in the Philippines.")
73
State ownership becomes much more pronounced.
Table 4: Control of Publicly Traded Companies in East Asia (weighted by market capitalization) State ownership becomes much more pronounced. The control of widely-held financial institutions and corporations is diminished, so is control by families.
 State ownership becomes much more pronounced. The control of widely-held financial institutions and corporations is diminished, so is control by families.")
74
Differences in Control due to Age of Companies
To investigate the relation between age and corporate control structuresRun simple correlations between the number of years the corporation has been in operation and the control stake (voting rights) of the largest owner. The results are presented in Table 5.
 of the largest owner. The results are presented in Table 5.")
75
Table 5: Correlation between Age and the Size of Control Stakes in East Asian Corporations (full samples) Only in Japan are older firms more widely-held. In the other eight countries, the correlation coefficients are always positive and statistically significant for the Indonesian, Malaysian, and Taiwan. The average age of listed Japanese corporates is about twice as high (57.2 years) as that of the other samples.
 as that of the other samples.")
76
Means of Enhancing Corporate Control
some other mechanisms which enhance corporate control even in the presence of small control stakes: the differences between cash-flow rights and voting powerfind evidence of use of multiple classes of voting rights, and pyramid structures the role of cross-holdings the magnitude of deviations from one-share-onevote through shares with different voting rights.

77
Table 6: Means of Enhancing Control (full samples, percentage of total)
deviations tend to be very small: on average 19.23% of all shares to get 20% of voting rights more than 2/5 of companies ultimate control at the 20% level involves the use of a pyramid structure. The largest in Indonesia (66.9%) and the smallest in Thailand (12.7%).
 and the smallest in Thailand (12.7%).")
78
Means of Enhancing Corporate Control
No significant evidence of cross-holdings, with the exception of Malaysia and Singapore where 14.9% and 15.7% of companies have some cross-ownership. Korean companies are above the average. Two additional means through which ultimate control is strengthened: to calculate the share of firms where there is a single controlling ownerdefined as somebody who has at least 10% of the voting rights. The data show that in more than half of the sample companies which are not widely-held at the 20% level the ultimate owners are alone. This share is the highest in Japan (87.2%) and the lowest in Thailand (18.9%), combined with the low degree of use of pyramids and cross-holdings, reflects the importance in Thailand of informal alliances among the small number of families controlling most of Thai companies.
 and. the lowest in Thailand (18.9%), combined with the low degree of use of pyramids and cross-holdings, reflects the importance in Thailand of informal alliances among the small number of families controlling most of Thai companies.")
79
Means of Enhancing Corporate Control
The separation of control and management whether a member of the controlling family, or an employee of the controlling widely held financial institution or corporation is the CEO, Chairman, Honorary Chairman, or Vice-Chairman of the company. On average, 2/3 of companies which are not widely held have the controlling owner appoint a member of top management. The numbers on managers affiliated to the controlling families are somewhat higher as the ones reported in La Porta, Lopez-de-Silanes, and Shleifer (1998). Overall, the results suggest some remarkable similarities across the nine East Asian countries in terms of the forms and means through which corporations are ultimately controlled.
. Overall, the results suggest some remarkable similarities across the nine East Asian countries in terms of the forms and means through which corporations are ultimately controlled.")
80
Cross-Country Differences in the Concentration of Control
Regression for the control structures on some simple proxies for firm- and country specific factors: CONTROLi = a + b1*log(Sizei) + b2*log (AGEi)+ b3*DEVIATEi + b4*MANAGERi + b5*PYRAMIDi + b6*log(GNP) + Country Dummies + Sector Dummies + uI CONTROL is the control stake of the largest ultimate owner of firm i, Size is the log-level of the share of market capitalization of firm i in total market capitalization within each country, AGE is log-level of the number of years since establishment of the firm. DEVIATE captures the firm-specific deviation from one-share-one-vote and is a discrete variable 1 if there are deviations between cash flow and control rights and 0 otherwise. MANAGER; dummies for companies where managers belong to the controlling families PYRAMID; where control is enhanced by pyramiding GNP;level of development of the country log-level of the per-capita GNP of that country in 1996.
 + b2*log (AGEi)+ b3*DEVIATEi + b4*MANAGERi + b5*PYRAMIDi + b6*log(GNP) + Country Dummies + Sector Dummies + uI. CONTROL is the control stake of the largest ultimate owner of firm i, Size is the log-level of the share of market capitalization of firm i in total market capitalization within each country, AGE is log-level of the number of years since establishment of the firm. DEVIATE captures the firm-specific deviation from one-share-one-vote and is a discrete variable 1 if there are deviations between cash flow and control rights and 0 otherwise. MANAGER; dummies for companies where managers belong to the controlling families. PYRAMID; where control is enhanced by pyramiding. GNP;level of development of the country log-level of the per-capita GNP of that country in")
81
Table 7 Determinants of the Concentration of Control
regression 1 the age of a company, deviations between cash-flow and control rights, and the presence of managers from the controlling family are all positively related to the concentration of control Regression 2including a proxy for each country’s overall level of economic development and dropping the country dummies. Consistent with the La Porta et al. (1998). High ultimate ownership is more likely observed in countries where minority protection is weak and the concentration of control diminishes with an increase in the level of economic development.
. High ultimate ownership is more likely observed in countries where minority protection is weak and the concentration of control diminishes with an increase in the level of economic development.")
82
The Aggregate Effects of Extensive Family Control
Perhaps a more meaningful unit of analysis, particularly if we are concerned with issues of market entry, access to financing, and government policy, is pattern of control of the corporate sector by family group(s). Analyze the number of firms in the sample controlled on average by a single family. The results are reported in Table 8 (first column). Indonesia has the largest number of companies controlled by a single family, more than four on average. Japan has the least number, each family controls approximately one company.
. Analyze the number of firms in the sample controlled on average by a single family. The results are reported in Table 8 (first column). Indonesia has the largest number of companies controlled by a single family, more than four on average. Japan has the least number, each family controls approximately one company.")
83
Table 8: How Concentrated is Family Control?
These numbers already suggest that the ultimate control of the corporate sector rests in the hands of a small number of families in most countries. These results suggest that a relatively small number of families effectively control most East Asian economies.

84
The Aggregate Effects of Extensive Family Control
Whether these families have a strong effect on the economic policy of governments? One direct mechanism for such an effect is the extension of preferential treatment to family members of senior government members. A case in point is the business empire of the Suharto family in Indonesia, which controls 417 listed and unlisted companies that we could identify in our sample through a number of business groups led by children, other relatives, and business partners, many of whom, besides Suharto himself, also serve in some government functions.

85
Figure 4: The Suharto Group

86
The Aggregate Effects of Extensive Family Control
Another mechanism of symbiosis between government and business is through indirect control of companies by the ruling political parties. The concentration of wealth, and the important direct and indirect channels through which the government may play an active role in business activity and businessmen may influence politicians, raises the possibility that the legal systems in some East Asian countries may be endogenous to the forms and concentration of control over the corporate sector. If the role of a limited number of families the corporate sector is large and the government is heavily involved in and influenced by business, the legal system is less likely to evolve in a manner to protect minority shareholders, and more generally to promote transparent and market-based activities.

87
The Aggregate Effects of Extensive Family Control
The correlations between the share of the largest fifteen families in total market capitalization, and the efficiency of the judicial system, the rule of law, and corruption, are very strong (Table 9) This suggests that the concentration of corporate control is a major determinant in the evolution of the legal system, i.e., relationships exist between ownership structure of the whole corporate sector and the level of institutional development, and as documented by La Porta et al. (1998), a relationship between the judicial and legal development and the ownership structures of individual corporations.
 This suggests that the concentration of corporate control is a major determinant in the evolution of the legal system, i.e., relationships exist between ownership structure of the whole corporate sector and the level of institutional development, and as documented by La Porta et al. (1998), a relationship between the judicial and legal development and the ownership structures of individual corporations.")
88
Table 9: Are Judicial Systems Endogenous?
The Pearson correlation coefficients: –0.807, , –0.841

89
Conclusions In most East Asian countries, wealth is very concentrated in the hands of few families and links between government and business are extensive. Legal and regulatory developments may have been impeded by the concentration of corporate wealth and the extensive links between corporations and government, either directly or indirectly. Relationships between patterns of ownership and legal and other institutional variables are not necessary casual, at least for some other countries. The possible endogeneity of the legal systems implies that future legal and regulatory reform in some East Asian countries may not be independent of changes in ownership structures and concentration of wealth.

90
Conclusions Insider-control may also have contributed to the weak performance and risky investment of many East Asian corporations prior to the crisis. The results allow for a reexamination of the relationships between ownership structure and corporate performance, since previous studies only looked at the immediate owners and not the ultimate control. The finding that many firms in East Asia belong to the same group and/or are controlled by a single family also suggests that further research may be warranted on the performance of firms belonging to the same group or controlled by the same family and on the corporate governance mechanisms used within such groups. These relationships between performance and ownership structures can be researched using data from before the crisis.

91
Conclusions The large shocks many firms experienced as a result of the East Asia financial crisis provide an unique opportunity to understand how resources are allocated within groups, especially as access to external financial markets was sharply diminished. This line of research may in turn offer several important insights as to how corporate governance and corporate restructuring in East Asia can be improved. Finally, the large role played by a few families in East Asian corporate sectors suggest that an investigation of the evolution of legal and judicial systems in relation to wealth concentration may be particularly insightful for some of these countries.

92
EXPROPRIATION OF MINORITY SHAREHOLDERS IN EAST ASIA Stijn Claessens, Simeon Djankov, Joseph P.H. Fan, and Larry H.P Lang 92

93
Existing Literatures : Ownership Structure and Corporate Performance
concentrated ownership is beneficial for corporate valuation, because large shareholders are better at monitoring managers (and because it reduces transaction costs in negotiating and enforcing corporate contracts with various stakeholders). (Jensen & Meckling, 1976)
. (Jensen & Meckling, 1976)")
94
Existing Literature…… (cont’d)
the absence of separation between ownership and control reduces conflicts-of-interest and thus increases shareholder value (Morck et al, 1988) Large shareholders better monitor managers, which in turn increases firm value (1986) Relatively Larger benefits from concentrated ownership in less developed countries where property rights are not well defined and or protected and enforced by judicial system
 Large shareholders better monitor managers, which in turn increases firm value (1986) Relatively Larger benefits from concentrated ownership in less developed countries where property rights are not well defined and or protected and enforced by judicial system.")
95
Existing Literature…… (cont’d)
Studies for the US : better monitoring and reduced agency costs are associated with more concentrated ownership A positive relation between ownership concentration and corporate valuation. Large shareholders better monitor management and thereby improve firm valuation.

96
Existing Literature…… (cont’d)
But : concentrated ownership can harm market valuation an inverse U-shaped relationship between ownership by managers and a firm's valuation and its profitability (Morck, Shleifer and Vishny , 1988) the conflict of interest between large and small shareholders : EXPROPRIATION OF MINORITY SHAREHOLDERS (Shleifer and Vishny (1997) and La Porta et al. (1999a)
 the conflict of interest between large and small shareholders : EXPROPRIATION OF MINORITY SHAREHOLDERS. (Shleifer and Vishny (1997) and La Porta et al. (1999a)")
97
Empirical studies on the expropriation and the means, when control rights of the ultimate owners are significantly in excess of cash flow rights : Use of deviation from one-share-one -vote rules, shares with superior voting rights (pyramid structures) in US, Sweden and Italy, Chaebols in Korea
 in US, Sweden and Italy, Chaebols in Korea.")
98
Reaping private benefits at the expense of the minority shareholders of the subsidiaries :
higher interest rates from creditor-owner than unaffiliated companies (in Japan and Korea) Selling ownership packages to related companies for a fraction of market prices (in Czech Republic)
 Selling ownership packages to related companies for a fraction of market prices (in Czech Republic)")
99
SO, The relative costs and benefits of different ownership structures depend on the difference between cash-flow and control rights of the major block-holder trace the ownership to firm’s ultimate owners or identify those owners by type, cash-flow and control stake (e.g La Porta, Lopez-de-Silanes, Shleifer , 1998)
")
100
La Porta, Lopez-de-Silanes, Shleifer (1998):
In majority from Largest 20 public firm in 27 rich countries : few corp are widely-held For 4 East Asia (EA) countries : - Japan &Korea : widely dispersed - HongKong : predominantly controlled by families - Singapore : by state
 countries : - Japan &Korea : widely dispersed. - HongKong : predominantly controlled by. families. - Singapore : by state.")
101
Data Description : A. Cash Flow vs Control Rights
Sample: 2,658 publicly- traded corp(financial and non financial institution) in HK, Ina, Jap, Korea, Mal, Phil, Sing, Tai, Thai Source : Worldscope Database (provide name & holdings of large investor) Asian Company Handbook 99, Japan Company Handbook 99; 97 Annual Reports of Jkt, HK, Seoul, KL Stock Exchange; Manila SExc, Korean Fair Trade Commision, Thai SExc handbook, Sing Investor Guide
 in HK, Ina, Jap, Korea, Mal, Phil, Sing, Tai, Thai. Source : Worldscope Database (provide name & holdings of large investor) Asian Company Handbook 99, Japan Company Handbook 99; 97 Annual Reports of Jkt, HK, Seoul, KL Stock Exchange; Manila SExc, Korean Fair Trade Commision, Thai SExc handbook, Sing Investor Guide.")
102
Data Description : A. Cash Flow vs Control Rights
Ownership and ultimate owners, stock market data, Int’l Acc Standard- Adjusted B/S and I/S, with sales data net of excise tax 2,153 Consolidated FS; plus 505 unconsolidated FS in robustness test

103
B. Measuring Performance
This approach defines the excess value (EXV) : Firms Actual Value Imputed Value The actual value is measured by market capitalization, the market value of common equity plus the book value of debt. The imputed value of the firm is obtained by summing the multiples across all of each firm’s segments. First, construct industry median market-to-sales ratio for each two-digit SIC code industry using only the single-segment firms in each country. The market-to-sales ratio is the market capitalization divided by firm sales. Then, multiply the level of sales in each segment of a firm by its corresponding industry median market-to-sales ratio. All Financial data are converted to USD using end-year exchange rate
 : Firms Actual Value. Imputed Value. The actual value is measured by market capitalization, the market value of common equity plus the book value of debt. The imputed value of the firm is obtained by summing the multiples across all of each firm’s segments. First, construct industry median market-to-sales ratio for each two-digit SIC code industry using only the single-segment firms in each country. The market-to-sales ratio is the market capitalization divided by firm sales. Then, multiply the level of sales in each segment of a firm by its corresponding industry median market-to-sales ratio. All Financial data are converted to USD using end-year exchange rate.")
104
4. Evidence of expropriation
EXV = Intercept + b1*CASH + b2*CES + u EXV = Intercept + b1*VOTES + b2*CES + u EXV = Intercept + b1*CASH + b2*VOTES b3*(CASH/VOTES) + b4*CES + u EXV is excess value, CASH is cash-flow rights of the largest block-holder, VOTES is the voting rights of the largest block-holder, CASH/VOTES is the ratio of cash-flow to voting rights of the largest block-holder. CES is capital expenditures over sales ratio, This ratio accounts for investment opportunities available to the firm (control variabel).
 + b4*CES + u. EXV is excess value, CASH is cash-flow rights of the largest block-holder, VOTES is the voting rights of the largest block-holder, CASH/VOTES is the ratio of cash-flow to voting rights of the largest block-holder. CES is capital expenditures over sales ratio, This ratio accounts for investment opportunities available to the firm (control variabel).")
105
Conclusions This paper documents the relation between concentration of ownership and control We find that higher cash-flow rights are associated with higher market valuation, but higher voting rights with lower market valuation. The separation of control from ownership is associated with lower market values, which we interpret as evidence of expropriation of minority shareholders by controlling shareholders.

106
Conclusions family control is an important factor behind the negative relation between control rights and market valuation. In contrast, we find no evidence of expropriation for state control and control by widely-held corporations. In Japan separation of cash-flow and voting rights in the hands of financial institutions lowers market valuation.

107
Conclusions The results on expropriation are the strongest for the Indonesian, Philippine, and Thai samples. We conclude that the risk of expropriation is the major principal-agent problem for large publicly-traded corporations, as suggested by La Porta et al. (1998), Bebchuk (1999), and Morck et al. (1999).
, Bebchuk (1999), and Morck et al. (1999).")
108
Conclusions It is likely that the degree to which certain ownership structures are associated with expropriation depends on country-specific circumstances. These may include the quality of banking systems, the legal and judicial protection of individual shareholders, and the degree of financial disclosure required.

Presentasi serupa


. Jenis Perancangan Riset Jenis perancangan mana yg akan digunakan ? Peneliti perlu memikirkan tentang apa yang mereka inginkan.>")


