Upload presentasi
Presentasi sedang didownload. Silahkan tunggu

1
Overview Diabetes Mellitus

2
Standar Kompetensi Dokter (2006)
")
5
Moduls consist of : Definition, presentation, diagnosis, classification Aetiopathology Management : Lifestyle modification (Basic carbohydrate counting) Management : Drug therapy Complication (acute & chronic) Prevention Children and Pregnancy
 Management : Drug therapy. Complication (acute & chronic) Prevention. Children and Pregnancy.")
6
DIABETES MELLITUS Definition, Presentation, Diagnosis, and Classification
Laksmi Sasiarini Divisi Endokrin – Metabolik FK UB – RSU dr. Saiful Anwar Malang 2011

7
Diabetes Mellitus A metabolic disorder of multiple aetiology characterized by chronic hyperglycaemia with disturbances of carbohydrate, fat and protein metabolism resulting from defects in insulin secretion, insulin action or both Associated with a risk of developing late diabetic complications including Microvascular (retinopathy, nephropathy) Macrovascular (atherosclerosis) Neuropathy
 Macrovascular (atherosclerosis) Neuropathy.")
8
Diabetes : A malignant vascular disorder
Stroke the most frequent cause of new cases of blindness among adults aged 20 to 74. Diabetic Retinopathy 2-4 x risk for stroke and coronary heart disease *) Cardiovascular disease Myocardiac infarct Diabetic Nephropathy Diabetic Neuropathy *) Most common cause of death in diabetics Diabetes mellitus is associated with a wide variety of microvascular and macrovascular complications. Accounts for ~40% of all new cases of end-stage renal disease (ESRD). Most common cause of renal failure → Dialysis Most common cause of lower limb amputation National Diabetes Information Clearinghouse. Diabetes Statistics–Complications of Diabetes.
 Cardiovascular disease. Myocardiac infarct. Diabetic Nephropathy. Diabetic Neuropathy. *) Most common cause of death in diabetics. Diabetes mellitus is associated with a wide variety of microvascular and macrovascular complications. Accounts for ~40% of all new cases of. end-stage renal disease (ESRD). Most common cause of renal failure → Dialysis. Most common cause of. lower limb amputation. National Diabetes Information Clearinghouse. Diabetes Statistics–Complications of Diabetes.")
9
GLYCEMIC GOALS IN ADULT
IDF AACE ADA HbA1C (%) < 6.5 ≤ 6.5 < 7.0 Fasting/preprandial glucose (mmol/L / mg/dL) < 6.0 / < 110 / 2-h postprandial glucose < 7.8 / < 140 < 10.0 / < 180* ADA recommends that postprandial glucose measurements should be made 1- 2h after the beginning of the meal IDF : International Diabetes Federation AACE : American Association of Clinical Endocrinologist
 < 6.5. ≤ 6.5. < 7.0. Fasting/preprandial glucose. (mmol/L / mg/dL) < 6.0 / < / h postprandial glucose. < 7.8 / < 140. < 10.0 / < 180* ADA recommends that postprandial glucose measurements should be made 1- 2h after the beginning of the meal. IDF : International Diabetes Federation. AACE : American Association of Clinical Endocrinologist.")
10
NHANES reveals the under-management of diabetes
NHANES 1999 – 2000 441 (6%) had previously diabetes Mean HbA1c value was 7.8% 37% had an HbA1c value <7.0% 26% had an HbA1c value of 7.0–8.0% 37% had an HbA1c value >8.0% Of the 4,874 adults who completed the 1999–2000 National Health and Nutrition Examination Survey (NHANES) in the USA, 441 (6%) had previously diagnosed diabetes. The mean HbA1c value in the subgroup with diabetes was 7.8%. Only 37% of these individuals had an HbA1c value <7.0%, and a further 26% had an HbA1c value of 7.0–8.0%. OHAs alone were the most common diabetes treatment (54%). Insulin therapy with or without OHAs was used by 10% and 17% of the survey’s diabetes population, respectively. The remaining 19% of individuals received neither insulin nor OHAs. NHANES highlights the under-management of diabetes. Almost two-thirds of the individuals with diabetes had poor glycaemic control, and yet insulin therapy is underutilised. Saydah S, et al. JAMA 2004;291:335–42. 54% Oral Hypoglycemic Agents 27% insulin therapy with or without OHAs 19% without any kind of drugs Saydah S, et al. JAMA 2004;291:335–42.
 had previously diabetes. Mean HbA1c value was 7.8% 37% had an HbA1c value <7.0% 26% had an HbA1c value of 7.0–8.0% 37% had an HbA1c value >8.0% Of the 4,874 adults who completed the 1999–2000 National Health and Nutrition Examination Survey (NHANES) in the USA, 441 (6%) had previously diagnosed diabetes. The mean HbA1c value in the subgroup with diabetes was 7.8%. Only 37% of these individuals had an HbA1c value <7.0%, and a further 26% had an HbA1c value of 7.0–8.0%. OHAs alone were the most common diabetes treatment (54%). Insulin therapy with or without OHAs was used by 10% and 17% of the survey’s diabetes population, respectively. The remaining 19% of individuals received neither insulin nor OHAs. NHANES highlights the under-management of diabetes. Almost two-thirds of the individuals with diabetes had poor glycaemic control, and yet insulin therapy is underutilised. Saydah S, et al. JAMA 2004;291:335–42. 54% Oral Hypoglycemic Agents. 27% insulin therapy with or without OHAs. 19% without any kind of drugs. Saydah S, et al. JAMA 2004;291:335–42.")
11
The implementation of the standards of care for diabetes has been supoptimal in most clinical settings. A recent report (Cheung et al, 2009) indicated that only 57.1% of adults with diabetes achieved an A1C of 7%, 45.5% had a blood pressure 130/80 mmHg, 46.5% had a total cholesterol 200 mg/dl. Only 12.2% of people with diabetes achieved all three treatment goals.
 indicated that only. 57.1% of adults with diabetes achieved an A1C of 7%, 45.5% had a blood pressure 130/80 mmHg, 46.5% had a total cholesterol 200 mg/dl. Only 12.2% of people with diabetes achieved all three treatment goals.")
12
Persentase kadar glukosa darah responden DDM
Persentase kadar glukosa darah responden DDM* setelah 2 jam pemberian diet cair 300 kalori JENIS KELAMIN KADAR GLUKOSA DARAH < 140 140 - < 200 ≥ 200 Laki-laki 33,1 17,8 49,1 Perempuan 17,3 15,9 66,8 *DDM : Diagnosed DM

13
Diabetes is an increasing healthcare epidemic throughout the world
IDF Regions and global projections for the number of people with diabetes (20-79 years), 55.2 66.2 +20% 37.4 53.2 +42% Africa Middle East and North Africa 76.7 112.8 +47% Europe 26.5 51.7 +94% North America South and Central America The IDF found that, as a global phenomenon, the prevalence of diabetes is predicted to increase from 246 million in 2007 to 380 million by 2025, an increase of 55%.1 T2DM alone has reached epidemic proportions and affects approximately 5.9% of adults worldwide. The prevalence is increasing steadily and is expected to affect 7.1% of adults by the year In particular, the increase in T2DM is seen among younger people and in developing countries. Indeed, a disproportionate number of diabetic patients live in the Asia-Pacific region; approximately 81 million people with diabetes live in India and China compared with 19 million in the USA.1 In summary, these data provide an updated quantification of the current and growing public health burden of diabetes across the world. The human and economic costs of this epidemic have severe implications for healthcare resource use. Reference International Diabetes Federation. Diabetes Atlas 3rd Edition (2006): Page 5 58.7 101.0 +72% South-East Asia 12.1 23.9 +98% Western Pacific 16.0 29.6 +65% Worldwide: 284.6 million people in 2010 438.4 million projected for 2030 54% increase IDF. Diabetes Atlas 4th Edition – 2009
, % % Africa. Middle East and North Africa % Europe % North America. South and Central America. The IDF found that, as a global phenomenon, the prevalence of diabetes is predicted to increase from 246 million in 2007 to 380 million by 2025, an increase of 55%.1 T2DM alone has reached epidemic proportions and affects approximately 5.9% of adults worldwide. The prevalence is increasing steadily and is expected to affect 7.1% of adults by the year In particular, the increase in T2DM is seen among younger people and in developing countries. Indeed, a disproportionate number of diabetic patients live in the Asia-Pacific region; approximately 81 million people with diabetes live in India and China compared with 19 million in the USA.1. In summary, these data provide an updated quantification of the current and growing public health burden of diabetes across the world. The human and economic costs of this epidemic have severe implications for healthcare resource use. Reference. International Diabetes Federation. Diabetes Atlas 3rd Edition (2006): Page % South-East Asia % Western Pacific % Worldwide: million people in million projected for % increase. IDF. Diabetes Atlas 4th Edition –")
14
Number of people with diabetes by age group,
2010 and 2030 IDF Diabetes Atlas, 4th ed. 2009

15
Number of people with diabetes (20-79 years), 2010 and 2030
Top 10 Number of people with diabetes (20-79 years), 2010 and 2030 IDF Diabetes Atlas, 4th ed. 2009
, 2010 and IDF Diabetes Atlas, 4th ed")
16
Data Riskesdas tahun 2007 Pengambilan darah vena untuk pemeriksaan glukosa darah dilakukan pada responden usia >15 tahun yang tinggal di daerah perkotaan (24,417 responden). Responden dipersiapkan puasa jam sebelum diambil darah, kemudian dilakukan TTGO, kecuali bagi pasien DM diberikan diet cair 300 kalori. Kriteria diagnosis DM dibuat berdasarkan WHO 1999 dan ADA 2003, di mana 2 jam setelah pembebanan glukosa didapatkan hasil GD : < 140 mg/dl Tidak DM 140 - < 200 mg/dl Toleransi Glukosa Terganggu (TGT) ≥ 200 mg/dl DM
. Responden dipersiapkan puasa jam sebelum diambil darah, kemudian dilakukan TTGO, kecuali bagi pasien DM diberikan diet cair 300 kalori. Kriteria diagnosis DM dibuat berdasarkan WHO 1999 dan ADA 2003, di mana 2 jam setelah pembebanan glukosa didapatkan hasil GD : < 140 mg/dl Tidak DM < 200 mg/dl Toleransi Glukosa Terganggu (TGT) ≥ 200 mg/dl DM.")
17
TGT DDM* UDDM** Total DM***
Penduduk perkotaan usia > 15 thn di Indonesia 10,2 1,5 4,2 5,7 *DDM : Diagnosed DM **UDDM : Undiagnosed DM ***Total DM : DDM + UDDM

18
Prediabetes Indonesian basic health research (Riskesdas)
Diagnosed DM = 1,5% Undiagnosed DM = 4,2% Total DM = 5,7% IGT = 10,2 % People who know they have diabetes People who don’t know they have diabetes

19
Prevalensi DM Tertinggi : Kalimantan Barat 11,1% Terendah :
4 3 1 2 Jawa Timur 6,8% Tertinggi : Kalimantan Barat 11,1% Maluku ,1% Riau ,4% NAD ,5% Terendah : Papua 1,7% NTT 1,8%

20
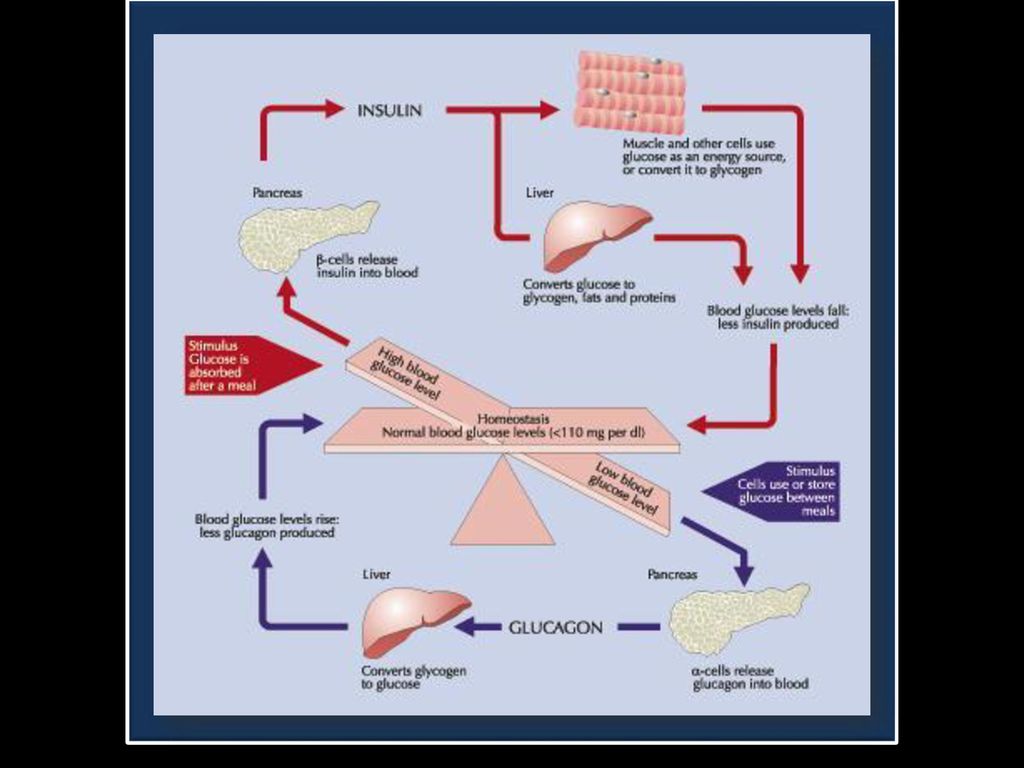
INSULIN & HOMEOSTASIS GLUKOSA

21
PANKREAS

22
Insulin production and action

24
Model of underlying factors in type 2 diabetes: -cell dysfunction and insulin resistance
Diabetes genes Adipokines Inflammation Hyperglycaemia Free fatty acids Other factors -CELL DYSFUNCTION Insulin secretion INSULIN RESISTANCE Lipolysis Glucose production Glucose uptake Free fatty acids Blood glucose Adapted from Stumvoll M et al. Lancet 2005; 365:1333–1346.

25
Siapa saja yang bisa terkena DM ?
1. Usia ≥ 45 tahun 2. Usia < 45 tahun, terutama dengan kegemukan, yang disertai dengan faktor resiko : • kebiasaan tidak aktif • turunan pertama dari orang tua dengan DM • riwayat melahirkan bayi dengan BB lahir bayi > 4000 gram, atau riwayat DM gestasional • hipertensi (≥ 140/90 mmHg) • kolesterol HDL ≤ 35 mg/dL dan atau trigliserida ≥ 250 mg/dL • menderita polycystic ovarial syndrome (PCOs) atau keadaan lain yang terkait dengan resistensi insulin • adanya riwayat toleransi glukosa terganggu (TGT) atau glukosa darah puasa terganggu (GDPT) sebelumnya → Prediabetes • memiliki riwayat penyakit jantung
 • kolesterol HDL ≤ 35 mg/dL dan atau trigliserida ≥ 250 mg/dL. • menderita polycystic ovarial syndrome (PCOs) atau keadaan lain yang terkait dengan resistensi insulin. • adanya riwayat toleransi glukosa terganggu (TGT) atau glukosa darah puasa terganggu (GDPT) sebelumnya → Prediabetes. • memiliki riwayat penyakit jantung.")
26
Puasa : <100 mg/dl IFG : 100-125 mg/dl >126 mg/dl
NORMAL PREDIABETES DIABETES Puasa : <100 mg/dl IFG : mg/dl >126 mg/dl 2 jam PP: <140 mg/dl IGT : mg/dl >200 mg/dl FPG : Fasting plasma glucose (Gula darah puasa) 2-h PG : 2-hour plasma glucose (Gula darah 2 jam setelah makan) IFG : Impaired fasting glucose (Gula darah puasa terganggu) IGT : Impaired glucose tolerance (Toleransi glukosa terganggu)
 2-h PG : 2-hour plasma glucose (Gula darah 2 jam setelah makan) IFG : Impaired fasting glucose (Gula darah puasa terganggu) IGT : Impaired glucose tolerance (Toleransi glukosa terganggu)")
27
Prevalensi TGT Tertinggi : Papua Barat 21,8% Terendah :
3 1 2 Jawa Timur 11,6% Jawa Timur 6,8% Tertinggi : Papua Barat ,8% Sulawesi Barat ,6% Sulawesi Utara ,3% Terendah : Jambi 4,0% NTT 4,9%

28
Prevalensi TGT dan DM menurut IMT, obesitas abdominal, dan hipertensi
Karakteristik responden TGT DM IMT : kurus 10,3 3,7 normal 9,1 4,4 BB lebih 12,3 7,3 obesitas 16,3 Perut : obesitas sentral (+) 15,9 9,7 obesitas sentral (-) 4,0 Hipertensi : (+) 15,1 9,0 (-) 8,4 3,4 *IMT : Indeks Massa Tubuh
 15,9. 9,7. obesitas sentral (-) 4,0. Hipertensi : (+) 15,1. 9,0. (-) 8,4. 3,4. *IMT : Indeks Massa Tubuh.")
30
Bagaimana diagnosis DM ditegakkan ?
1. Gejala klasik DM + GDA 200 mg/dL atau 2. Gejala klasik DM + GDP 126 mg/dL dengan puasa 8 jam 3. 2 jam PP TTGO 200 mg/dL TTGO dengan beban 75 g glukosa Keluhan klasik DM : rasa haus yang berlebihan, sering kencing terutama malam hari dan berat badan menurun dengan cepat. Keluhan lain dapat berupa lemah badan, kesemutan, gatal, mata kabur, gairah seks menurun, luka sukar sembuh.

31
Relation of FPG, 2hrPG, A1C to Retinopathy : Pima Indians
15 FPG 2hPG A1C 10 Retinopathy (%) 5 Key Points The relationships between FPG, 2hPG and the development of retinopathy were evaluated in Pima Indians over a wide range of plasma glucose cut-points. Both variables were associated with retinopathy, indicating that both could work as diagnostic measures for diabetes. McCance et al, the authors, concluded that both of these measurements were equal relative to the properties used previously to determine diagnostic criteria. Report of the Expert Committee on the Diagnosis and Classification of Diabetes Mellitus. Diabetes Care 2003;26 (S1):S5-S20. FPG (mg/dL) 2hPG (mg/dL) A1C (%) 70- 38- 3.4- 89- 94- 4.8- 93- 106- 5.0- 97- 116- 5.2- 100- 126- 5.3- 105- 138- 5.5- 109- 156- 5.7- 116- 185- 6.0- 136- 244- 6.7- 226- 364- 9.5- ADA Expert Committee. Diabetes Care 2003;26(S1):S5-S20.
 5. Key Points. The relationships between FPG, 2hPG and the development of retinopathy were evaluated in Pima Indians over a wide range of plasma glucose cut-points. Both variables were associated with retinopathy, indicating that both could work as diagnostic measures for diabetes. McCance et al, the authors, concluded that both of these measurements were equal relative to the properties used previously to determine diagnostic criteria. Report of the Expert Committee on the Diagnosis and Classification of Diabetes Mellitus. Diabetes Care 2003;26 (S1):S5-S20. FPG (mg/dL) 2hPG (mg/dL) A1C (%) ADA Expert Committee. Diabetes Care 2003;26(S1):S5-S20.")
32
Relation of FPG, 2hPG, A1C to Retinopathy : NHANES III
15 FPG 2hPG A1C 10 Retinopathy (%) 5 Key Points NHANES III looked at 2821 subjects aged 40 to 74 years who had an OGTT, A1C measurement, and retinopathy assessment by means of fundus photography. While all measures were associated with retinopathy, the strongest was for 2hPG. Report of the Expert Committee on the Diagnosis and Classification of Diabetes Mellitus. Diabetes Care 2003;26 (S1):S5-S20. FPG (mg/dL) 2hPG (mg/dL) A1C (%) 42- 34- 3.3- 87- 75- 4.9- 90- 86- 5.1- 93- 94- 5.2- 96- 102- 5.4- 98- 112- 5.5- 101- 120- 5.6- 104- 133- 5.7- 109- 154- 5.9- 120- 195- 6.2- ADA Expert Committee. Diabetes Care 2003;26(S1):S5-S20.
 5. Key Points. NHANES III looked at 2821 subjects aged 40 to 74 years who had an OGTT, A1C measurement, and retinopathy assessment by means of fundus photography. While all measures were associated with retinopathy, the strongest was for 2hPG. Report of the Expert Committee on the Diagnosis and Classification of Diabetes Mellitus. Diabetes Care 2003;26 (S1):S5-S20. FPG (mg/dL) 2hPG (mg/dL) A1C (%) ADA Expert Committee. Diabetes Care 2003;26(S1):S5-S20.")
33
Relation of FPG, 2hPG, A1C to Retinopathy : Egypt
50 FPG 2hPG A1C 40 30 Retinopathy (%) 20 Key Points Similar findings were confirmed as a result of a study done in Egypt, which showed that the FPG and 2hPG were strongly and equally associated with retinopathy. For both measures, retinopathy prevalence was significantly higher at the point at which the two components of the bimodal frequency distribution intersected. Report of the Expert Committee on the Diagnosis and Classification of Diabetes Mellitus. Diabetes Care 2003;26 (S1):S5-S20. 10 FPG (mg/dL) 2hPG (mg/dL) A1C (%) 57- 39- 2.2- 79- 80- 4.7- 84- 90- 4.9- 89- 99- 5.1- 93- 110- 5.4- 99- 125- 5.6- 108- 155- 6.0- 130- 218- 6.9- 178- 304- 8.5- 258- 386- 10.3- ADA Expert Committee. Diabetes Care 2003;26(S1):S5-S20.
 20. Key Points. Similar findings were confirmed as a result of a study done in Egypt, which showed that the FPG and 2hPG were strongly and equally associated with retinopathy. For both measures, retinopathy prevalence was significantly higher at the point at which the two components of the bimodal frequency distribution intersected. Report of the Expert Committee on the Diagnosis and Classification of Diabetes Mellitus. Diabetes Care 2003;26 (S1):S5-S FPG (mg/dL) 2hPG (mg/dL) A1C (%) ADA Expert Committee. Diabetes Care 2003;26(S1):S5-S20.")
34
Type 2 Diabetes: Progression from Underlying Defects
Insulin Insulin Macrovascular Sensitivity Secretion Diseases 30% 50% 50% 50% 70%-100% 40% 70% 150% 10% 100% 100% Type 2 Diabetes IGT Impaired Glucose Metabolism This figure shows that the underlying problems associated with diabetes are present long before a diagnosis of diabetes can be made by today’s standards. As insulin sensitivity decreases, insulin production increases up to a point where the pancreas can no longer sustain these secretion levels. By the time of overt diabetes, the pancreas’ ability to produce insulin is already severely impaired by years of overproduction. Additionally, macrovascular disease begins early and 50 per cent of patients with type 2 diabetes have evidence of macrovascular disease. Normal Glucose Metabolism Adapted from Groop.Diabetes Obesity Metab 1999;1(Suppl.1):S1-S7.
:S1-S7.")
35
The progressive nature of type 2 diabetes
Normal Impaired glucose tolerance Type 2 diabetes Late type 2 diabetes complications Insulin sensitive Hyperglycaemia Normal insulin secretion Insulin resistance β-cell exhaustion Normoglycaemia Insulin resistance Fasting plasma glucose Insulin sensitivity Insulin secretion Adapted from Bailey CJ et al. Int J Clin Pract 2004; 58:867–876. Groop LC. Diabetes Obes Metab 1999; 1 (Suppl. 1):S1–S7.
:S1–S7.")
36
KLASIFIKASI DM Tipe 1 Destruksi sel beta, umumnya menjurus ke defisiensi insulin absolut Autoimun Idiopatik Tipe 2 Bervariasi mulai yang terutama dominan resistensi insulin disertai defisiensi insulin relatif sampai yang terutama defek sekresi insulin disertai resistensi insulin Tipe lain Defek genetik fungsi sel beta Defek genetik kerja insulin Penyakit eksokrin pankreas Endokrinopati Karena obat atau zat kimia Infeksi Sebab imunologi yang jarang Sindrom genetik lain yang berkaitan dengan DM Diabetes mellitus gestasional

37
GLYCEMIC GOALS IN ADULT
IDF AACE ADA HbA1C (%) < 6.5 ≤ 6.5 < 7.0 Fasting/preprandial glucose (mmol/L / mg/dL) < 6.0 / < 110 / 2-h postprandial glucose < 7.8 / < 140 < 10.0 / < 180* ADA recommends that postprandial glucose measurements should be made 1- 2h after the beginning of the meal IDF : International Diabetes Federation AACE : American Association of Clinical Endocrinologist
 < 6.5. ≤ 6.5. < 7.0. Fasting/preprandial glucose. (mmol/L / mg/dL) < 6.0 / < / h postprandial glucose. < 7.8 / < 140. < 10.0 / < 180* ADA recommends that postprandial glucose measurements should be made 1- 2h after the beginning of the meal. IDF : International Diabetes Federation. AACE : American Association of Clinical Endocrinologist.")
38
The New Paradigm of (Type 2) Diabetes Treatment
Treatment – Driven by Target (A1C<7%) Early Combinations (including with insulin) Aggressive Insulin Treatment
 Early Combinations (including with insulin) Aggressive Insulin Treatment.")
40
Thank You

Presentasi serupa


>")


