Upload presentasi
Presentasi sedang didownload. Silahkan tunggu

1
MK. Manajemen Kesuburan Tanah
DASAR ILMU TANAH, 2003 Bahan kajian pada MK. Manajemen Kesuburan Tanah LENGAS TANAH DAN PENGELOLAANNYA Diabstraksikan oleh: smno.jurstnh.fpub.sept2012

2
LENGAS TANAH = SOIL MOISTURE
LENGAS (Moisture) menyatakan adanya suatu cairan, terutama air , seringkali dalam jumlah terbatas. Sejumlah air ditemukan dalam udara (kelembaban udara), dalam tanah (lengas tanah) . Kadar lengas tanah merupakan kuantitas air yang terkandung dalam tanah. Kadar lengas dinyatakan sebagai rasio , yang berkisar dari 0 (kering lengkap) hingga nilai jenuh. Kadar lengas ini dapat dinyatakan secara volumetrik atau gravimetrik.
 menyatakan adanya suatu cairan, terutama air , seringkali dalam jumlah terbatas. Sejumlah air ditemukan dalam udara (kelembaban udara), dalam tanah (lengas tanah) . Kadar lengas tanah merupakan kuantitas air yang terkandung dalam tanah. Kadar lengas dinyatakan sebagai rasio , yang berkisar dari 0 (kering lengkap) hingga nilai jenuh. Kadar lengas ini dapat dinyatakan secara volumetrik atau gravimetrik.")
3
Kadar air volumetrik , θ, dirumuskan sebagai:
dimana : Vw adalah volume air VT = Vs + Vv = Vs + Vw + Va adalah total volume (vol tanah + vol. air + rongga udara).
.")
4
Kadar air Gravimetrik dirumuskan sbb:
Dimana: mw adalah masa air mb adalah masa total. Masa total adalah masa tanah kering mutlak Untuk mengubah kadar air gravimetrik menjadi kadar air volumetrik, kalikan kadar air gravimetrik dengan berat isi tanah.

5
STRUKTUR & CIRI Molekul air terdiri atas atom oksigen dan dua atom hidrogen, yang berikatan secara kovalen Atom-atom tidak terikat secara linear (H-O-H), tetapi atom hidrogen melekat pada atom oksigen seperti huruf V dengan sudut 105o. Molekul air bersifat dipolar: Zone elektro positif + H H 105o Zone elektro negatif -
, tetapi atom hidrogen melekat pada atom oksigen seperti huruf V dengan sudut 105o. Molekul air bersifat dipolar: Zone elektro positif. + H H. 105o. Zone elektro negatif. -")
6
POLARITAS MOLEKUL AIR

7
Partikel koloidal yang bersifat hidrofilik dan selubung hidrasinya

8
SIFAT-SIFAT FISIK AIR

9
Diunduh dari: http://ktcomilloniportfolio.wikispaces.com/Weathering
PROFIL TANAH Soils- soil is made of loose, weathered rock and organic material in which plants with root can grow. The rock material is composed sand, silt, and clay. Parent material- the material from which a soil is formed. Residual Soil- soil that has the bedrock beneath the soil as a parent material Transported Soil- soild formed from deposits left by winds, rivers, and glaciers. A-Horizaon (Top Soil)- darkest color due to organic material. B-Horizaon (Subsoil)- 1) clay is washed to the subsoil 2) May contain soluble minerals, such as calcium and magnesium carbonates 3) color is usually red- brown from iron oxides that form above and wash down C-Horizon- Made of slightly weathered parent material (rock fragments) Diunduh dari:
- darkest color due to organic material. B-Horizaon (Subsoil)- 1) clay is washed to the subsoil 2) May contain soluble minerals, such as calcium and magnesium carbonates 3) color is usually red- brown from iron oxides that form above and wash down C-Horizon- Made of slightly weathered parent material (rock fragments) Diunduh dari:")
10
Diunduh dari: http://ag.arizona.edu/pubs/garden/mg/soils/soils.html
PROFIL TANAH . Soil Horizons or Layers Many soils have two or more distinct layers or horizons. The principal horizons (collectively called the soil profile) are: A, surface soil; E, the subsurface; and B, the subsoil. Beneath the soil profile lies: C, the parent material; and R, rock, which may be similar to that from which the soil developed. Many soils in Arizona have developed in water-deposited (alluvium), wind- deposited (aeolian silt or sand), or gravity transported material (colluvium). When soil horizons are present , they usually differfrom one another in color, texture, consistency, and structure. In addition, there are usually considerable differences in chemical characteristics or composition. The surface and subsurface are usually the coarsest layers. The surface soil contains more organic matter than the other soil layers. Organic matter gives a gray, dark-brown, or black color to the surface horizon, the color imparted depending largely upon the amount of organic matter present. Soils that are highest in organic matter usually have the darkest surface colors. The surface layer is usually most fertile and has the greatest concentration of plant roots; plants obtain much of their nutrients and water from the surface soil. Any human activity which removes or degrades the surface soils is very serious considering the relatively higher quality of this horizon. The subsoil layer is usually finer and firmer than the surface soil. Organic matter content of the subsoil is usually much lower than that of the surface layer. The subsoil supports the surface soil and may be considered the soil reservoir, providing storage space for water and nutrients for plants, aiding in temperature regulation of the soil, and supplying air for the roots of plants. Diunduh dari:
 are: A, surface soil; E, the subsurface; and B, the subsoil. Beneath the soil profile lies: C, the parent material; and R, rock, which may be similar to that from which the soil developed. Many soils in Arizona have developed in water-deposited (alluvium), wind- deposited (aeolian silt or sand), or gravity transported material (colluvium). When soil horizons are present , they usually differfrom one another in color, texture, consistency, and structure. In addition, there are usually considerable differences in chemical characteristics or composition. The surface and subsurface are usually the coarsest layers. The surface soil contains more organic matter than the other soil layers. Organic matter gives a gray, dark-brown, or black color to the surface horizon, the color imparted depending largely upon the amount of organic matter present. Soils that are highest in organic matter usually have the darkest surface colors. The surface layer is usually most fertile and has the greatest concentration of plant roots; plants obtain much of their nutrients and water from the surface soil. Any human activity which removes or degrades the surface soils is very serious considering the relatively higher quality of this horizon. The subsoil layer is usually finer and firmer than the surface soil. Organic matter content of the subsoil is usually much lower than that of the surface layer. The subsoil supports the surface soil and may be considered the soil reservoir, providing storage space for water and nutrients for plants, aiding in temperature regulation of the soil, and supplying air for the roots of plants. Diunduh dari:")
11
Soil horizons and depth
. Soil horizons and depth A relatively undisturbed soil viewed in profile typically reveals, from the surface down, an organic layer, a topsoil layer (the "A" horizon) and two layers or horizons below Soil profiles vary considerably from one locale or region to the next, depending on geology, hydrology and climate. On sites with a history of construction or agricultural use, mixing, tilling, filling or excavating may have significantly altered some horizons. Soil depth is the depth of the soil above bedrock. Soils more than 75 cm (30 in.) deep offer better growing conditions than shallower soils and can support a greater variety of plants. Some tree species, such as oaks and hickories, send out long taproots, so they need deep soil. However, many plants are well adapted to shallow soils. If you live in a region with shallow soils, confirm that species are suitable when selecting plants. Diunduh dari:
 and two layers or horizons below. Soil profiles vary considerably from one locale or region to the next, depending on geology, hydrology and climate. On sites with a history of construction or agricultural use, mixing, tilling, filling or excavating may have significantly altered some horizons. Soil depth is the depth of the soil above bedrock. Soils more than 75 cm (30 in.) deep offer better growing conditions than shallower soils and can support a greater variety of plants. Some tree species, such as oaks and hickories, send out long taproots, so they need deep soil. However, many plants are well adapted to shallow soils. If you live in a region with shallow soils, confirm that species are suitable when selecting plants. Diunduh dari:")
12
HIDROLOGI PERMUKAAN LAHAN
It is recognized that vegetation, soil moisture, and soil temperature influence: the partitioning of surface radiation forcing into sensible and latent heat fluxes; water vapor and temperature in the lower atmosphere; and deep convection initiation and development Diunduh dari:

13
Soil Moisture Monitoring: What Does 65% Depletion Mean?
by Jim Bauder and Linzy Carlson "Just what do you mean when you say that alfalfa doesn't need to be irrigated until 65% depletion of the soil moisture, yet beans and potatoes need to be irrigated at 40% depletion? I really can't visualize that or put a number on what that means in terms of when I need to irrigate. " How Much Water the Crop is Using The crop is alfalfa, and the soil survey says that the first foot of the profile is silty clay loam with 10% rock. The next foot and a half is fine sandy loam with 20% rock, and the next foot and a half is silty clay with 30% rock. For each soil type, multiply the depth by the number of inches of water held per foot of soil (Table 2) by the rock adjustment factor. This gives the total available water. Of that 6.3", only 65%, or 4.1", is actually available to the alfalfa crop. Therefore, you should be irrigating when the crop has used 4.1". Diunduh dari:
 by the rock adjustment factor. This gives the total available water. Of that 6.3 , only 65%, or 4.1 , is actually available to the alfalfa crop. Therefore, you should be irrigating when the crop has used Diunduh dari:")
14
AVAILABLE WATER CAPACITY
The first step is to determine the available water capacity (AWC) of the soil profile. This is when you need to know the soil texture by depth as deep as the roots of the crop. Table 1. Crop Rooting Depth and Maximum Allowable Depletion Crop Rooting Depth Depletion Allowance Alfalfa 4 feet 65% Grass Meadow 3 feet 60% Cereal Crops 2.5 feet 40-50% Sugar Beets 40% Potatoes or Corn 2 feet Beans or Peas 1.5 feet Table 2. Soil Texture and Available Water Capacity in Inches/Foot II. Adjust for Rocks Soil Texture Feels Like . . . AWC (inches/foot) Coarse sand, sand sand, grit Fine sand, very fine sand fine grit, sand 1.25 Loamy coarse sand, loamy sand sandy, loamy 1.0 Loamy fine sand smooth, fine grit Coarse sandy soam, sandy loam smooth with grit Fine sandy soam Loam, silt loam smooth 2.0 Silt, sandy clay loam smooth, slippery Clay loam, silty clay loam sticky but smooth 2.2 Sandy clay, silty clay smooth and sticky Clay sticky Diunduh dari:
 of the soil profile. This is when you need to know the soil texture by depth as deep as the roots of the crop. Table 1. Crop Rooting Depth and Maximum Allowable Depletion. Crop. Rooting Depth. Depletion Allowance. Alfalfa. 4 feet. 65% Grass Meadow. 3 feet. 60% Cereal Crops. 2.5 feet % Sugar Beets. 40% Potatoes or Corn. 2 feet. Beans or Peas. 1.5 feet. Table 2. Soil Texture and Available Water Capacity in Inches/Foot II. Adjust for Rocks. Soil Texture. Feels Like AWC (inches/foot) Coarse sand, sand. sand, grit Fine sand, very fine sand. fine grit, sand Loamy coarse sand, loamy sand. sandy, loamy Loamy fine sand. smooth, fine grit. Coarse sandy soam, sandy loam. smooth with grit Fine sandy soam Loam, silt loam. smooth Silt, sandy clay loam. smooth, slippery Clay loam, silty clay loam. sticky but smooth Sandy clay, silty clay. smooth and sticky. Clay. sticky. Diunduh dari:")
15
Peranan air dalam tumbuhan hidup:
Komponen protoplasm Substrat untuk metabolisme tanaman Solvent untuk absorpsi dan transportasi Menjaga tanaman tetap dalam bentuknya Menjaga keseimbangan suhu tubuh tanaman Root zone soil water extraction and plant root development patterns. Corn does not extract water uniformly throughout its rooting depth. Generally, more water is extracted from shallow depths and less from deeper depths. If water is applied to the soil surface, the typical extraction pattern follows the rule: 40 percent of the water comes from the top 1/4 of the root zone, 30 percent comes from the second 1/4 and so on. The rule is illustrated in Figure . Water applied using subsurface drip irrigation systems will result in more water removal from the depth where the drip lines are placed. In addition, though corn roots can reach depths of 5 to 6 feet, until late in the season conservative irrigation management assumes a 3-foot effective root zone. Later, when predicting the timing and amount of the last irrigation, the effective root zone is expanded to 4 feet. Diunduh dari:

16
SOIL-WATER AND PLANT STRESS
The relationship between water distribution in the soil and the concept of irrigation scheduling when 50 percent of the PAW has been depleted. As a plant extracts water from the soil, the amount of PAW remaining in the soil decreases. The amount of PAW removed since the last irrigation or rainfall is the depletion volume. Irrigation scheduling decisions are often based on the assumption that crop yield or quality will not be reduced as long as the amount of water used by the crop does not exceed the allowable depletion volume. Most crops will recover overnight from temporary wilting if less than 50 percent of the PAW has been depleted. Therefore, the allowable depletion volume generally recommended in North Carolina is 50 percent (Figure). However, the recommended volume may range from 40 percent or less in sandy soils to greater than 60 percent in clayey soils. The allowable depletion is also dependent on the type of crop, its stage of development, and its sensitivity to drought stress. For example, the allowable depletion recommended for some drought-sensitive crops (vegetable crops in particular) is only 20 percent during critical stages of development. The allowable depletion may approach 70 percent during noncritical periods for drought-tolerant crops such as soybeans or cotton. Diunduh dari: .
. However, the recommended volume may range from 40 percent or less in sandy soils to greater than 60 percent in clayey soils. The allowable depletion is also dependent on the type of crop, its stage of development, and its sensitivity to drought stress. For example, the allowable depletion recommended for some drought-sensitive crops (vegetable crops in particular) is only 20 percent during critical stages of development. The allowable depletion may approach 70 percent during noncritical periods for drought-tolerant crops such as soybeans or cotton. Diunduh dari: .")
17
PENYERAPAN AIR OLEH AKAR TANAMAN
Penyerapan air pada tumbuhan dilakukan dengan dua cara yaitu penyerapan air secara aktif dan penyerapan air secara pasif. Penyerapan air secara aktif dilakukan oleh sel hidup. Pada penyerapan ini sel memerlukan energi. Kemampuan penyerapan air ini dipengaruhi oleh kendungan O2. Apabila akar tanaman mendapat 02 yang cukup proses penyerapan air oleh akar akan berlangsung sangat lancar. Sebaliknya apabilla 02 sangat kurang, penyerapan air oleh akar akan sangat lambat atau tidak terjadi sama sekali. Teori ini didukung oleh beberapa bukti : a. Akar tanaman yang hidup pada tanah yang aerasinya buruk, bentuk akarnya menggulung. b. Apabila respirasi dihalangi dengan zat penghalang misalnya KCN, maka absorpsi air akan berkurang. c. Absorpsi air hanya dilakukan oleh sel yang hidup. Penyerapan air secara pasif terjadi sebagai akibat dari proses transpirasi . Semakin lancar transpirasi , semakin lancar pula absorpsi air oleh akar.

18
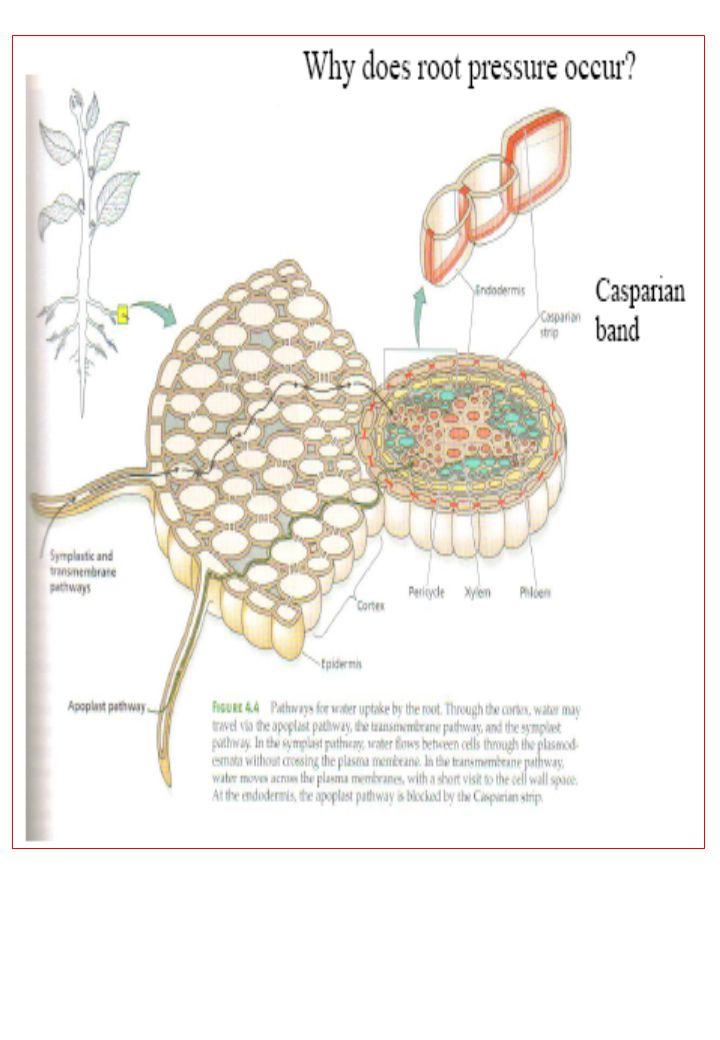
Transpor lateral air dalam akar :
Ada dua jalur dalam akar untuk menyerap air dari tanah. Setiap jalur ini mempunyai keunggulan dan kelemahannya. Jalur Apoplastik dapat terjadi kalau tidak ada hypodermis . Air bergerak menembus dinding sel dan rongga-rongga antar sel. Kalau air mengalir, zat terlarut ikut bergerak bersama aliran atau dengan cara difusi. Jalur ini sangat efisien. Jalur Symplastik, dapat eterjadi kalau ada hypodermis. Air bergerak menembus membran sel dan sel-sel hidup. Air bergerak secara osmosis, sehingga solutes dapat bergerak dari sel ke sel melalui plasmodesmata. Proses ini lebih lambat dibandingkan dengan jalur apoplastik.

19
Penyerapan air oleh akar tanaman
Zone penyerapan air Bagian utama untuk penyerapan air: Zone bulu akar Model Ujung Akar

20
Bulu-bulu akar, zone penyerapan air

21
Anatomi ujung akar: Dinding sel tipis Konduktivitas air lebih baik Jaringan pemb uluh tumbuh-kembang dengan baik

22
Penyerapan air oleh akar tanaman:
Proses aktif Proses pasif Proses penyerapan air secara aktif: Penyerapan air berlangsung oleh adanya aktivitas fisiologis akar tanaman Apoplast: Suatu sistem kontinyu terdiri atas dinding sel, rongga sel (interplace) dan pembuluh xylem, kecuali protoplast, dianggap sebagai bagian yang mati . • Resistensi rendah dan transpor air lebih cepat . Symplast: Suatu sistem kontinyu terdiri atas protoplast, plasmodesma dan membran plasma, dianggap sebagai bagian yang hidup . • Air memasuki simplast dengan cara osmosis dan kemudian air diangkut melintasi sel ke sel.
 dan pembuluh xylem, kecuali protoplast, dianggap sebagai bagian yang mati . • Resistensi rendah dan transpor air lebih cepat . Symplast: Suatu sistem kontinyu terdiri atas protoplast, plasmodesma dan membran plasma, dianggap sebagai bagian yang hidup . • Air memasuki simplast dengan cara osmosis dan kemudian air diangkut melintasi sel ke sel.")
24
Jalur APOPLASTIK dan Jalur SIMPLASTIK

25
Transpirasi ini kira-kira mencapai 10% dari total penguapan air.
Transpirasi merupakan penguapan air ke atmosfir melalui daun dan batang tumbuhan. Tanaman menyerap air tanah oleh sistem perakarannya; air ini berasal dari beragam kedalaman tanah. Misalnya, tanaman jagung mempunyai perakaran hingga kedalaman 2.5 meter, sedanghkan bebertapa tumbuhan iklim kering mampu menumbuhkan akarnya hingga kedalaman 20 meter. Tanaman memompa air dari tanah untuk mengangkut unsur hara menuju ke daun. Proses pemompaan air ini ditarik oleh penguapan air melalui "stomates", yang berada di permukaan bawah daun. Transpirasi ini kira-kira mencapai 10% dari total penguapan air.

26
Transpiration Sejumlah air dilepaskan oleh tumbuhan ke atmosfer melalui proses transpirasi. Untuk membantu proses fotosintesis, tumbuhan menyerap air dari tanah melalui akarnya. Tumbuhan menguapkan air ini ke atmosfir melalui permukaan daun dan batangnya. Sekitar 70 % dari total hujan dikembalikan ke atmosfer melalui proses evaporasi dan transpirasi.

27
TRANSPIRASI Power-- Transpiration pull :
• Transpiration pull: kekuatan yang mendirong air bergerak ke atas sepanjang saluran pembuluh xylem ditentukan oleh gradien potential air karena adanya transpirasi. • Independent terhadap metabolisme akar • Sarana utama untuk penyerapan air . • Teruitama pada kondisi transpirasi intensif. • Tanaman dapat menyerap air secara aktif pada kondisi transpirari rendah atau tanpa transpirasi, sep[erti misalnya pada awal musim semi dan ketika daun masih belum mengembang.

28
Faktor yang mempengaruhi penyerapan air oleh akar:
Faktor Internal , derajat perkembangan, konduktivitas air dan respirasi akar Faktor eksternal: faktor udara→ transpirasi → Penyerapan air (tidak langsung) . 3. Faktor Tanah secara langsung mempengartuhi penyerapan air oleh akar.
 . 3. Faktor Tanah secara langsung mempengartuhi penyerapan air oleh akar.")
29
Teori Pompa Kalium atau Penyerapan Ion Anorganik:
Perubahan K+ dan pH pada guard-cell dan sel sekitarnya selama membuka dan menutupnya stomata

30
Faktor yang mempengaruhi membuka-menutup stomata
(1) Cahaya: Membentuk guyla dan malate, akumulasi K+ dan Cl- • Sekitar 2.5% cahaya matahari penuh • Peka terhadap sinar biru, UV-A receptor (reseptor sinar biru) • Banyak gen yang mengendalikan perilaku stomata
 Cahaya: Membentuk guyla dan malate, akumulasi K+ dan Cl- • Sekitar 2.5% cahaya matahari penuh. • Peka terhadap sinar biru, UV-A receptor (reseptor sinar biru) • Banyak gen yang mengendalikan perilaku stomata.")
31
Faktor membuka-menutup Stomata:
(2) CO2: Banyak CO2 , stomata membuka; Sedikit CO2 , stomata menutup karena acidification dan K+ keluar dari guard cell. (3) Lembab nisbi atmosfir : Lebih tinggi RH, membuka lebih besar. Lebih rendah RH, kehilangan air dari Guard cell. (4) Temperatur. Peningkatan suhu udara akan meningkatkan membukanya stomata. Suhu optimum 30oC, membuka lebih sedikit pada suhu >35oC (5) Kadar air dan kadar K daun Cukupnya air dan kalium, stomata membuka lebar. Terlalu banyak air menghambat membukanya stomata (6) Hormon tanaman ABA--- menutup, ABA merangsang peningkatan Ca2+ dalam cytosol, secara tidak langsung mengakibatkan aliran ke luar K+ , Cl- dari guard-cell dan menghambat masuknya K+ ke dalam guard cell. IAA , CTK mendorong membukanya stomata.
 CO2: Banyak CO2 , stomata membuka; Sedikit CO2 , stomata menutup karena acidification dan K+ keluar dari guard cell. (3) Lembab nisbi atmosfir : Lebih tinggi RH, membuka lebih besar. Lebih rendah RH, kehilangan air dari Guard cell. (4) Temperatur. Peningkatan suhu udara akan meningkatkan membukanya stomata. Suhu optimum 30oC, membuka lebih sedikit pada suhu >35oC. (5) Kadar air dan kadar K daun. Cukupnya air dan kalium, stomata membuka lebar. Terlalu banyak air menghambat membukanya stomata. (6) Hormon tanaman. ABA--- menutup, ABA merangsang peningkatan Ca2+ dalam cytosol, secara tidak langsung mengakibatkan aliran ke luar K+ , Cl- dari guard-cell dan menghambat masuknya K+ ke dalam guard cell. IAA , CTK mendorong membukanya stomata.")
32
Model guard cell , melukiskan fungsi-fungsi saluran ion dalam signaling ABA dan menutupnya stomata. Bagian sebelah kanan menunjukkan saluran ion dan regulator yang memediasi menutupnya stomata yang dipacu oleh ABA . Sebelah kiri sel menunjukkan efek paralel dari peningkatan [Ca2+] sitoplasma yang dipacu oleh ABA dan akan menghambat mekanisme membukanya stomata

33
Kondisi internal tanaman dan Lingkungan yang mempengaruhi transpirasi

34
Transpor air dalam tumbuhan

35
Transpor air dalam tubuh tanaman:
Dengan bantuan gaya kohesi dan adhesi , pohon yang tinggi dapat emengangkut air hingga setinggi lebih 100 meter.

36
Kekuatan / Daya Transpor air: • Root pressure in bottom,
• Transpiration pull in top

37
Suhu tanah dan penyerapan air oleh akar tanaman
Suhu rendah: viskositas air dan plasma meningkat; konduktivitas air menurun; respirasi menurun karena energi tidak cukup; pertumbuhan akar dan bulu akar menurun. Suhu terlalu tinggi: akar mudah membentuk gabus, konduktivitas air menurun.

38
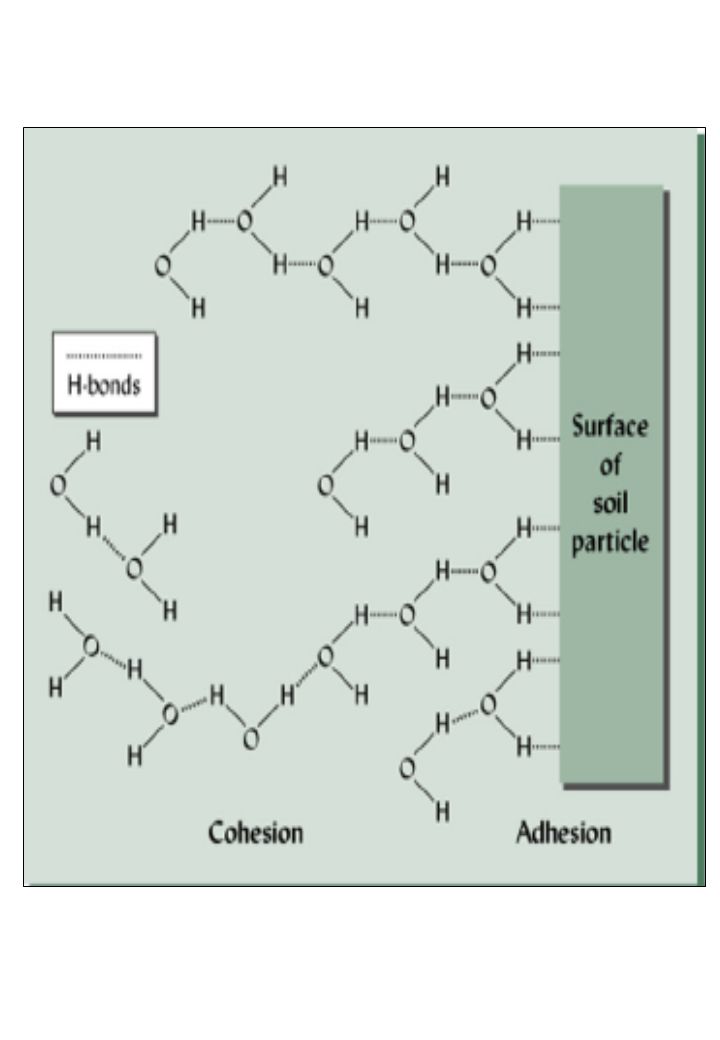
AIR TANAH Kekuatan ikatan antara molekul air dengan partikel tanah dinyatakan dengan TEGANGAN AIR TANAH. Ini merupakan fungsi dari gaya-gaya adesi dan kohesi di antara molekul - molekul air dan partikel tanah Adesi Kohesi H2O Partikel tanah Air terikat Air bebas

39
Kalau tanah kering, porinya terisi udara.
Partikel tanah bersingguingan satu sama lain dan ada rongga di antaranya (pori tanah). Kalau tanah kering, porinya terisi udara. Setelah hujan , pori tanah terisi dengan air. Akar tanaman dapat membantu aerasi tanah.
. Kalau tanah kering, porinya terisi udara. Setelah hujan , pori tanah terisi dengan air. Akar tanaman dapat membantu aerasi tanah.")
42
STRUKTUR & CIRI POLARITAS
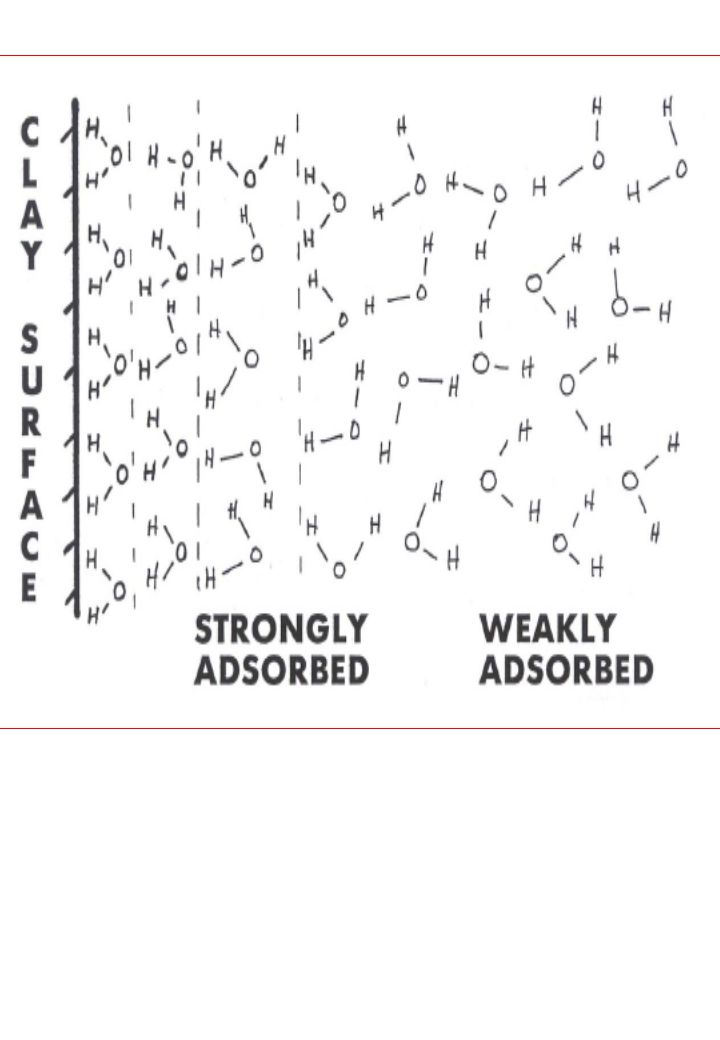
Molekul air mempunyai dua ujung, yaitu ujung oksigen yg elektronegatif dan ujung hidrogen yang elektro-positif. Dalam kondisi cair, molekul-molekul air saling bergandengan membentuk kelompok-kelompok kecil tdk teratur. Ciri polaritas ini menyebabkan plekul air tertarik pada ion-ion elektrostatis. Kation-kation K+, Na+, Ca++ menjadi berhidrasi kalau ada molekul air, membentuk selimut air, ujung negatif melekat kation. Permukaan liat yang bermuatan negatif, menarik ujung positif molekul air. Kation hidrasi Tebalnya selubung air tgt pd rapat muatan pd per- mukaan kation. Rapat muatan = Selubung air muatan kation / luas permukaan

43
STRUKTUR & CIRI IKATAN HIDROGEN
Atom hidrogen berfungsi sebagai titik penyambung (jembatan) antar molekul air. Ikatan hidrogen inilah yg menyebabkan titik didih dan viskositas air relatif tinggi KOHESI vs. ADHESI Kohesi: ikatan hidrogen antar molekul air Adhesi: ikatan antara molekul air dengan permukaan padatan lainnya Melalui kedua gaya-gaya ini partikel tanah mampu menahan air dan mengendalikan gerakannya dalam tanah TEGANGAN PERMUKAAN Terjadinya pada bidang persentuhan air dan udara, gaya kohesi antar molekul air lebih besra daripada adhesi antara air dan udara. Udara Permukaan air-udara air
 antar molekul air. Ikatan hidrogen inilah yg menyebabkan titik didih dan viskositas air relatif tinggi. KOHESI vs. ADHESI. Kohesi: ikatan hidrogen antar molekul air. Adhesi: ikatan antara molekul air dengan permukaan padatan lainnya. Melalui kedua gaya-gaya ini partikel tanah mampu menahan air dan mengendalikan gerakannya dalam tanah. TEGANGAN PERMUKAAN. Terjadinya pada bidang persentuhan air dan udara, gaya kohesi antar molekul air lebih besra daripada adhesi antara air dan udara. Udara. Permukaan air-udara. air.")
44
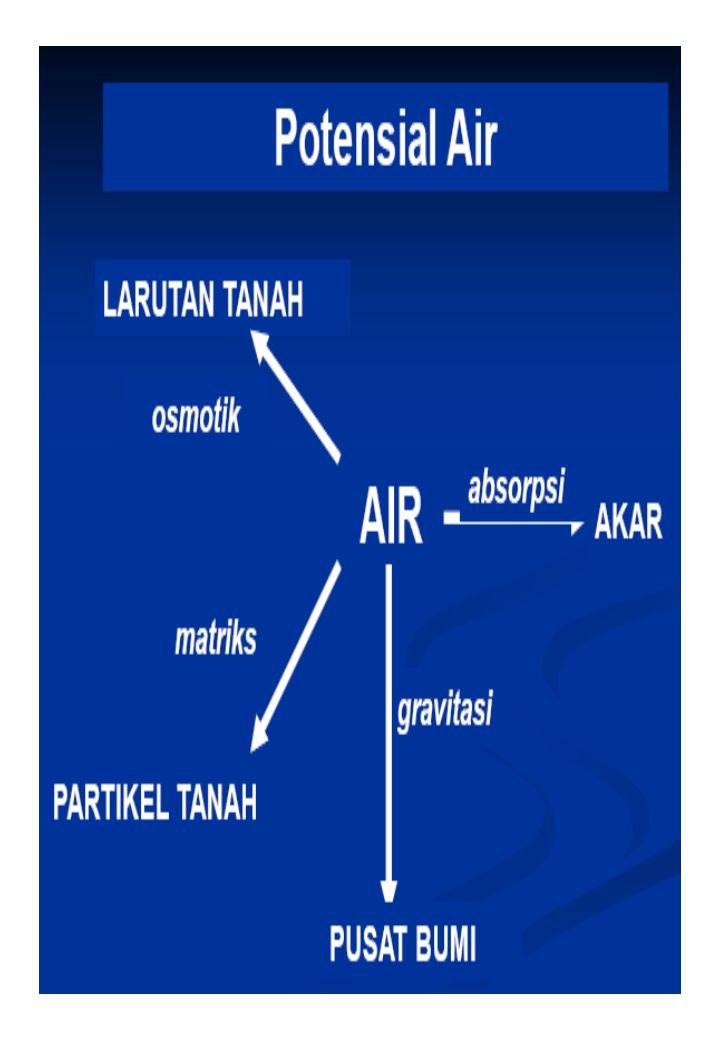
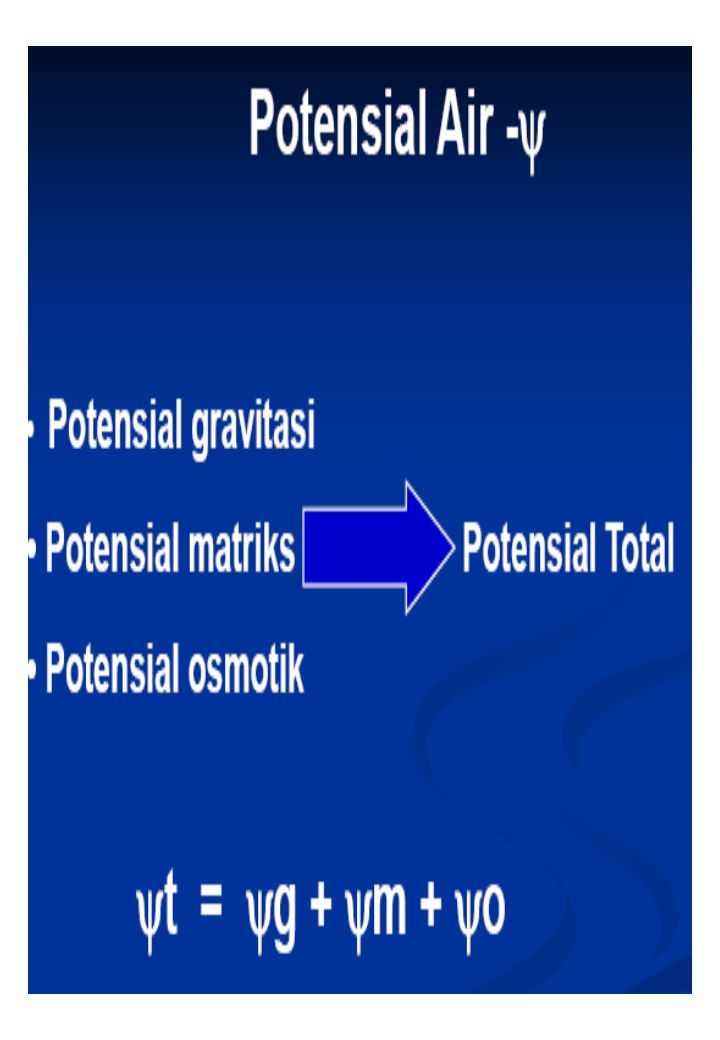
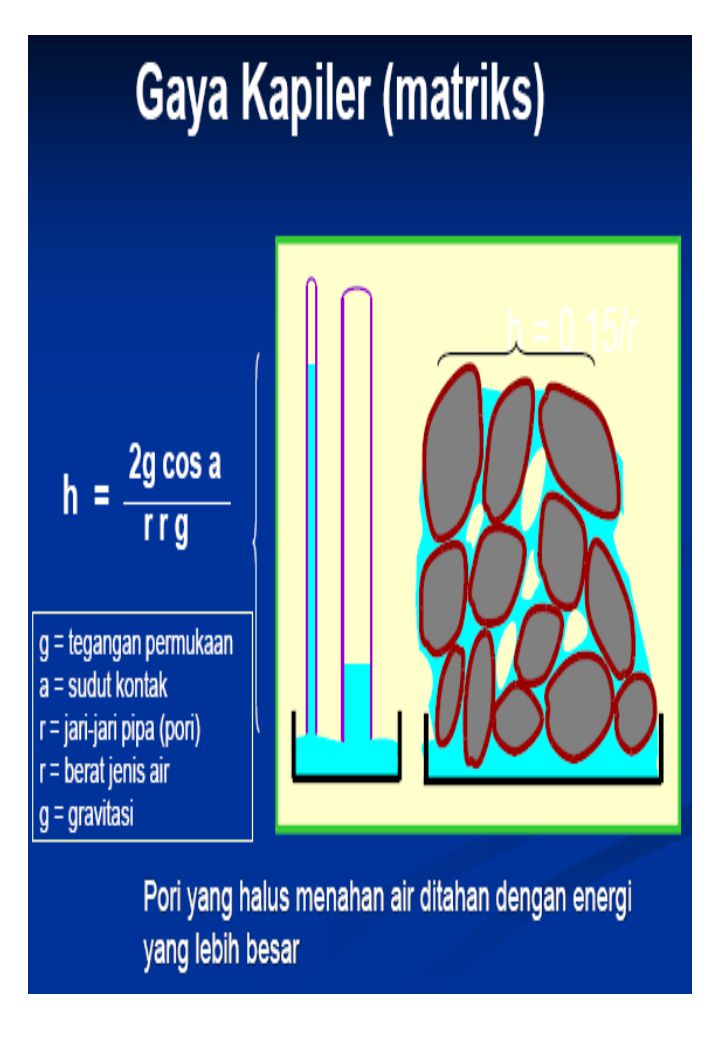
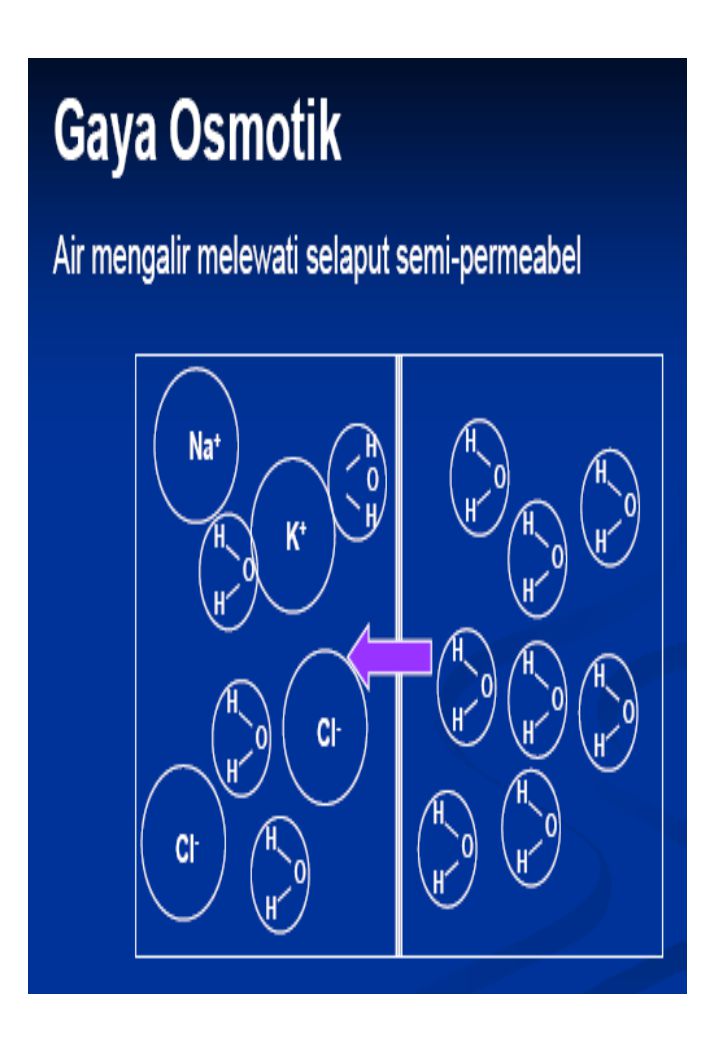
ENERGI AIR TANAH Retensi dan pergerakan air tanah melibatkan energi, yaitu: Energi Potensial, Energi Kinetik dan Energi Elektrik. Selanjutnya status energi dari air disebut ENERGI BEBAS, yang merupakan PENJUMLAHAN dari SEMUA BENTUK ENERGI yang ada. Air bergerak dari zone air berenergi bebas tinggi (tanah basah) menuju zone air berenergi bebas rendah (tanah kering). Gaya-gaya yg berpengaruh Gaya matrik: tarikan padatan tanah (matrik) thd molekul air; Gaya osmotik: tarikan kation-kation terlarut thd molekul air Gaya gravitasi: tarikan bumi terhadap molekul air tanah. Potensial air tanah Ketiga gaya tersebut di atas bekerja bersama mempengaruhi energi bebas air tanah, dan selanjutnya menentukan perilaku air tanah, ….. POTENSIAL TOTAL AIR TANAH (PTAT) PTAT adalah jumlah kerja yg harus dilakukan untuk memindahkan secara berlawanan arah sejumlah air murni bebas dari ketinggian tertentu secara isotermik ke posisi tertentu air tanah. PTAT = Pt = perbedaan antara status energi air tanah dan air murni bebas Pt = Pg + Pm + Po + ………………………… ( t = total; g = gravitasi; m = matrik; o = osmotik)
 menuju zone air berenergi bebas rendah (tanah kering). Gaya-gaya yg berpengaruh. Gaya matrik: tarikan padatan tanah (matrik) thd molekul air; Gaya osmotik: tarikan kation-kation terlarut thd molekul air. Gaya gravitasi: tarikan bumi terhadap molekul air tanah. Potensial air tanah. Ketiga gaya tersebut di atas bekerja bersama mempengaruhi energi bebas air tanah, dan selanjutnya menentukan perilaku air tanah, ….. POTENSIAL TOTAL AIR TANAH (PTAT) PTAT adalah jumlah kerja yg harus dilakukan untuk memindahkan secara berlawanan arah sejumlah air murni bebas dari ketinggian tertentu secara isotermik ke posisi tertentu air tanah. PTAT = Pt = perbedaan antara status energi air tanah dan air murni bebas. Pt = Pg + Pm + Po + ………………………… ( t = total; g = gravitasi; m = matrik; o = osmotik)")
48
Bentuk-bentuk Potensial air –Ψ

53
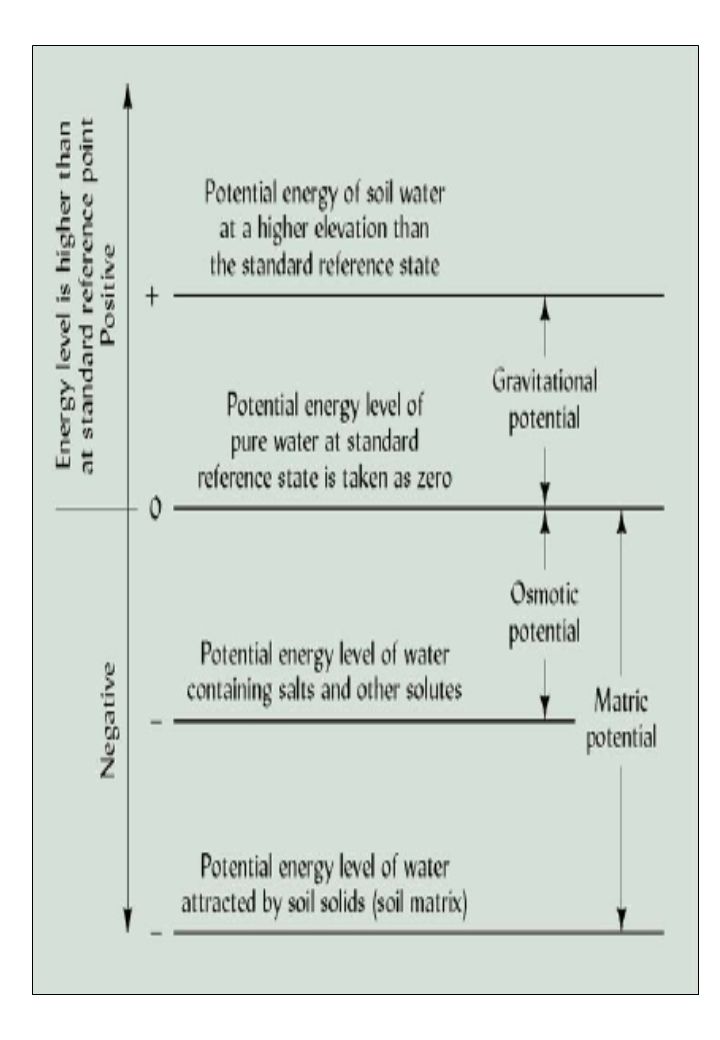
Hubungan potensial air tanah dengan energi bebas
Energi bebas naik bila air tanah berada pada letak ketinggian yg lebih tinggi dari titik baku pengenal (referensi) + Poten-sial positif Energi bebas dari air murni Potensial tarikan bumi Potensial osmotik (hisapan) Menurun karena pengaruh osmotik Poten-sial negatif Potensial matrik (hisapan) Menurun karena pengaruh matrik - Energi bebas dari air tanah
 + Poten-sial positif. Energi bebas dari air murni. Potensial tarikan bumi. Potensial osmotik (hisapan) Menurun karena pengaruh osmotik. Poten-sial negatif. Potensial matrik (hisapan) Menurun karena pengaruh matrik. - Energi bebas dari air tanah.")
54
POTENSIAL AIR TANAH POTENSIAL TARIKAN BUMI = Potensial gravitasi
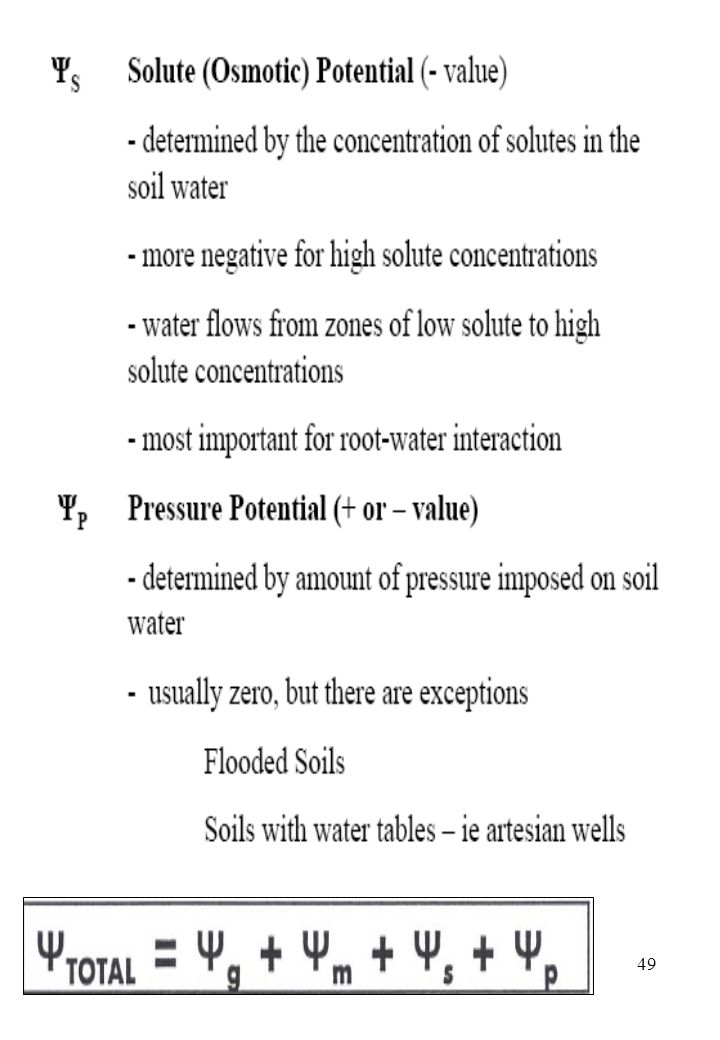
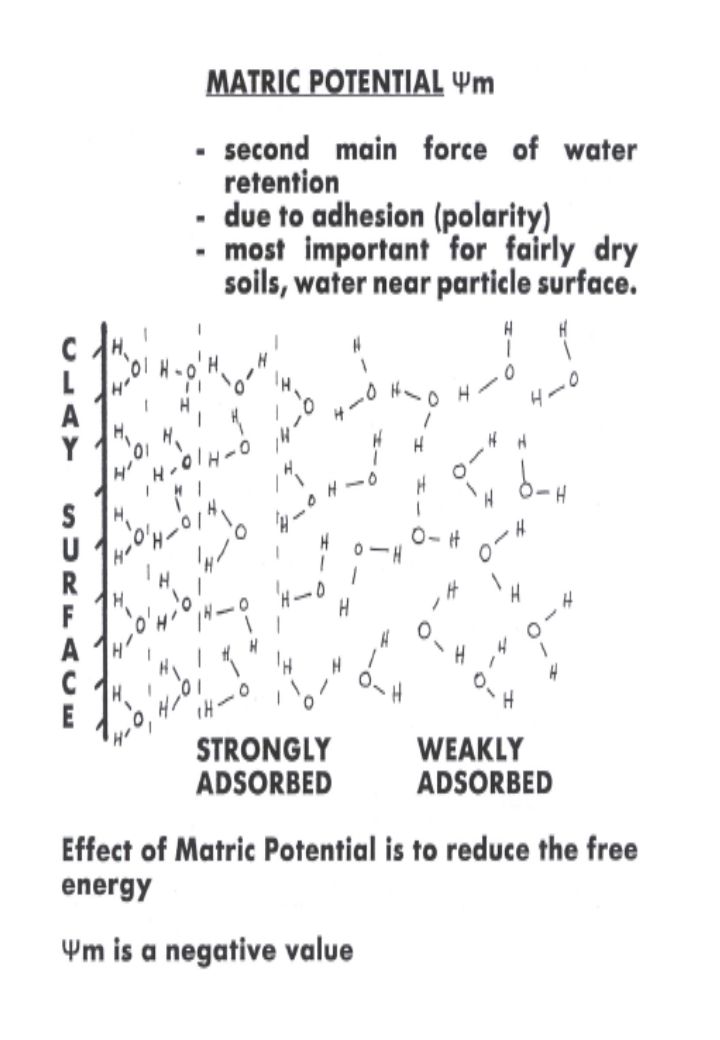
Pg = G.h dimana G = percepatan gravitasi, h = tinggi air tanah di atas posisi ketinggian referensi. Potensial gravitasi berperanan penting dalam menghilangkan kelebihan air dari bagian atas zone perakaran setelah hujan lebat atau irigasi Potensial matrik dan Osmotik Potensial matrik merupakan hasil dari gaya-gaya jerapan dan kapilaritas. Gaya jerapan ditentukan oleh tarikan air oleh padatan tanah dan kation jerapan Gaya kapilaritas disebabkan oleh adanya tegangan permukaan air. Potensial matriks selalu negatif Potensial osmotik terdapat pd larutan tanah, disebabkan oleh adanya bahan-bahan terlarut (ionik dan non-ionik). Pengaruh utama potensial osmotik adalah pada serapan air oleh tanaman Hisapan dan Tegangan Potensial matrik dan osmotik adalah negatif, keduanya bersifat menurunkan energi bebas air tanah. Oleh karena itu seringkali potensial negatif itu disebut HISAPAN atau TEGANGAN. Hisapan atau Tegangan dapat dinyatakan dengan satuan-satuan positif. Jadi padatan-tanah bertanggung jawab atas munculnya HISAPAN atau TEGANGAN.
. Pengaruh utama potensial osmotik adalah pada serapan air oleh tanaman. Hisapan dan Tegangan. Potensial matrik dan osmotik adalah negatif, keduanya bersifat menurunkan energi bebas air tanah. Oleh karena itu seringkali potensial negatif itu disebut HISAPAN atau TEGANGAN. Hisapan atau Tegangan dapat dinyatakan dengan satuan-satuan positif. Jadi padatan-tanah bertanggung jawab atas munculnya HISAPAN atau TEGANGAN.")
56
Cara Menyatakan Tegangan Energi
Tegangan: dinyatakan dengan “tinggi (cm) dari satuan kolom air yang bobotnya sama dengan tegangan tsb”. Tinggi kolom air (cm) tersebut lazimnya dikonversi menjadi logaritma dari sentimeter tinggi kolom air, selanjutnya disebut pF. Tinggi unit Logaritma Bar Atmosfer kolom air (cm) tinggi kolom air (pF)
 dari satuan kolom air yang bobotnya sama dengan tegangan tsb . Tinggi kolom air (cm) tersebut lazimnya dikonversi menjadi logaritma dari sentimeter tinggi kolom air, selanjutnya disebut pF. Tinggi unit Logaritma Bar Atmosfer. kolom air (cm) tinggi kolom air (pF)")
57
KANDUNGAN AIR DAN TEGANGAN
KURVA ENERGI - LENGAS TANAH Tegangan air menurun secara gradual dengan meningkatnya kadar air tanah. Tanah liat menahan air lebih banyak dibanding tanah pasir pada nilai tegangan air yang sama Tanah yang Strukturnya baik mempunyai total pori lebih banyak, shg mampu menahan air lebih banyak Pori medium dan mikro lebih kuat menahan air dp pori makro Tegangan air tanah, Bar 10.000 Liat Lempung Pasir 0.01 10 Kadar air tanah, % 70

58
Liat Lempung Pasir Potensial air tanah
Strukturnya baik Strukturnya jelek Liat Lempung Kdr a i r t nh Kd r A i r t nh Pasir Potensial air tanah

59
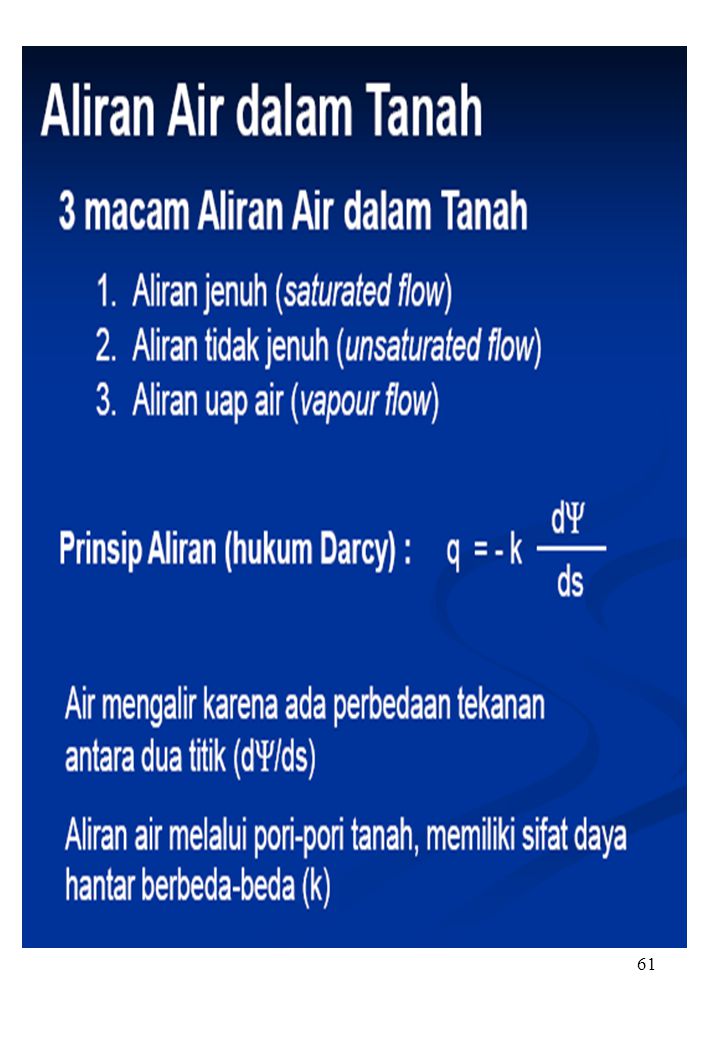
Gerakan Air Tanah Tidak Jenuh
Gerakan tidak jenuh = gejala kapilaritas = air bergerak dari muka air tanah ke atas melalui pori mikro. Gaya adhesi dan kohesi bekerja aktif pada kolom air (dalam pri mikro), ujung kolom air berbentuk cekung. Perbedaan tegangan air tanah akan menentukan arah gerakan air tanah secara tidak jenuh. Air bergerak dari daerah dengan tegangan rendah (kadar air tinggi) ke daerah yang tegangannya tinggi (kadar air rendah, kering). Gerakan air ini dapat terjadi ke segala arah dan berlangsung secara terus-menerus. Pelapisan tanah berpengaruh terhadap gerakan air tanah. Lapisan keras atau lapisan kedap air memperlambat gerakan air Lapisan berpasir menjadi penghalang bagi gerakan air dari lapisan yg bertekstur halus. Gerakan air dlm lapisan berpasir sgt lambat pd tegangan
, ujung kolom air berbentuk cekung. Perbedaan tegangan air tanah akan menentukan arah gerakan air tanah secara tidak jenuh. Air bergerak dari daerah dengan tegangan rendah (kadar air tinggi) ke daerah yang tegangannya tinggi (kadar air rendah, kering). Gerakan air ini dapat terjadi ke segala arah dan berlangsung secara terus-menerus. Pelapisan tanah berpengaruh terhadap gerakan air tanah. Lapisan keras atau lapisan kedap air memperlambat gerakan air. Lapisan berpasir menjadi penghalang bagi gerakan air dari lapisan yg bertekstur halus. Gerakan air dlm lapisan berpasir sgt lambat pd tegangan.")
62
Gerakan Jenuh (Perkolasi)
Air hujan dan irigasi memasuki tanah, menggantikan udara dalam pori makro - medium - mikro. Selanjutnya air bergerak ke bawah melalui proses gerakan jenuh dibawah pengaruh gaya gravitasi dan kapiler. Gerakan air jenuh ke arah bawah ini berlangsung terus selama cukup air dan tidak ada lapisan penghalang Lempung berpasir Lempung berliat cm 15 mnt 4 jam 30 60 jam jam 120 24 jam jam 150 30 cm cm Jarak dari tengah-tengah saluran, cm

63
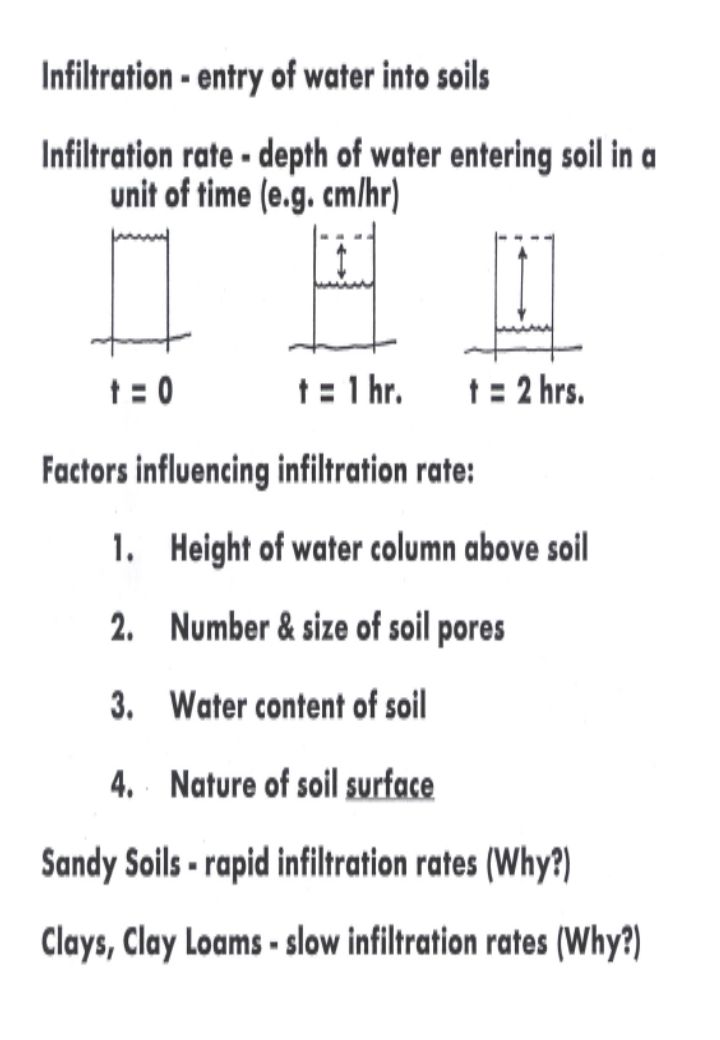
PERKOLASI Jumlah air perkolasi Faktor yg berpengaruh: 1. Jumlah air yang ditambahkan 2. Kemampuan infiltrasi permukaan tanah 3. Daya hantar air horison tanah 4. Jumlah air yg ditahan profil tanah pd kondisi kapasitas lapang Keempat faktor di atas ditentukan oleh struktur dan tekstur tanah Tanah berpasir punya kapasitas ilfiltrasi dan daya hantar air sangat tinggi, kemampuan menahan air rendah, shg perkolasinya mudah dan cepat Tanah tekstur halus, umumnya perkolasinya rendah dan sangat beragam; faktor lain yg berpengaruh: 1. Bahan liat koloidal dpt menyumbat pori mikro & medium 2. Liat tipe 2:1 yang mengembang-mengkerut sangat berperan

64
LAJU GERAKAN AIR TANAH Kecepatan gerakan air dlm tanah dipengaruhi oleh dua faktor: 1. Daya dari air yang bergerak 2. Hantaran hidraulik = Hantaran kapiler = daya hantar i = k.f dimana i = volume air yang bergerak; f = daya air yg bergerak dan k = konstante. Daya air yg bergerak = daya penggerak, ditentukan oleh dua faktor: 1. Gaya gravitasi, berpengaruh thd gerak ke bawah 2. Selisih tegangan air tanah, ke semua arah Gerakan air semakin cepat kalau perbedaan tegangan semakin tinggi. Hantaran hidraulik ditentukan oleh bbrp faktor: 1. Ukuran pori tanah 2. Besarnya tegangan untuk menahan air Pada gerakan jenuh, tegangan airnya rendah, shg hantaran hidraulik berbanding lurus dengan ukuran pori Pd tanah pasir, penurunan daya hantar lebih jelas kalau terjadi penurunan kandungan air tanah Lapisan pasir dlm profil tanah akan menjadi penghalang gerakan air tidak jenuh

65
Gerakan air tanah dipengaruhi oleh kandungan air tanah
Penetrasi air dari tnh basah ke tnh kering (cm) 18 Tanah lembab, kadar air awal 29% Tanah lembab, kadar air awal 20.2% Tanah lembab, kadar air awal 15.9% Jumlah hari kontak, hari Sumber: Gardner & Widtsoe, 1921.
 18. Tanah lembab, kadar air awal 29% Tanah lembab, kadar air awal 20.2% Tanah lembab, kadar air awal 15.9% Jumlah hari kontak, hari. Sumber: Gardner & Widtsoe,")
66
Pergerakan air tanah: Kondisi Jenuh Air

67
Pergerakan air dalam profil tanah :
Pergerakan air melalui zone tidak jenuh dan zone jenuh menuju “water table” Pergerakan air ini arahnya ke bawah dan ke atas

68
Profil lengas tanah dalam kondisi tergenang:
Distribusi air selama proses infiltrasi pada kondisi tergenang. Ada lima zone dalam profil tanah yang terkait dengan proses infiltrasi . Profil lengas tanah dalam kondisi tergenang:

69
Zone jenuh. Pori terisi openuh dengan air (jenuh air)
Zone jenuh. Pori terisi openuh dengan air (jenuh air). Tergantung pada lamanya waktu sejak masukan air , zone ini biasanya hanya sampai kedalaman beberapa millimeters. Zone Transisi. Zone ini dicirikan oleh cepatnya penurunan kadar air tanah dengan kedalaman, dan akan meluas hingga beberapa centimeter. Zone Transmission . Zone ini dicirikan oleh kecilnya perubahan kadar lengas dengan kedalaman tanah. Biasanya zone transmission ini merupakan zone tidak jenuh yang memanjang yang kadar airnya seragam. Gaya gravitasi berperan dominan dalam gradien hidraulik. Zone pembasahan. Dalam zone ini, kadar lengas menurun tajam dengan kedalaman tanah, mulai dari kadar air zone transmission hingga mendekati kadar air awal dari tanah. Front Pembasahan. Zone ini dicirikan oleh gradien hidraulik yang tajam, dan membentuk batas yang jelas antara tanah kering dan tanah basah. Gradien hidraulik ini terutama dicirikan oleh potensial matriks.
. Tergantung pada lamanya waktu sejak masukan air , zone ini biasanya hanya sampai kedalaman beberapa millimeters. Zone Transisi. Zone ini dicirikan oleh cepatnya penurunan kadar air tanah dengan kedalaman, dan akan meluas hingga beberapa centimeter. Zone Transmission . Zone ini dicirikan oleh kecilnya perubahan kadar lengas dengan kedalaman tanah. Biasanya zone transmission ini merupakan zone tidak jenuh yang memanjang yang kadar airnya seragam. Gaya gravitasi berperan dominan dalam gradien hidraulik. Zone pembasahan. Dalam zone ini, kadar lengas menurun tajam dengan kedalaman tanah, mulai dari kadar air zone transmission hingga mendekati kadar air awal dari tanah. Front Pembasahan. Zone ini dicirikan oleh gradien hidraulik yang tajam, dan membentuk batas yang jelas antara tanah kering dan tanah basah. Gradien hidraulik ini terutama dicirikan oleh potensial matriks.")
70
Potensial Matriks Lengas Tanah

71
Fungsi gaya-gaya adesi dan kohesi Pergerakan kapilaritas air
Kapilaritas adalah kecenderungan air untuk bergerak nauik ke atas melawan gaya gravitasi Fungsi gaya-gaya adesi dan kohesi Pergerakan kapilaritas air

72
Pasir berlempung Lempung liat Pasir Waktu, hari

73
Pencucian hara dari lapisan olah tanah

74
GERAKAN UAP AIR Penguapan air tanah terjadi internal (dalam pori tanah) dan eksternal (di permukaan tanah) Udara tanah selalu jenus uap air, selama kadar air tanah tidak lebih rendah dari koefisien higroskopis (tegangan 31 atm). Mekanisme Gerakan uap air Difusi uap air terjadi dlm udara tanah, penggeraknya adalah perbedaan tekanan uap air. Arah gerapan menuju ke daerah dg tekanan uap rendah Pengaruh suhu dan lengas tanah terhadap gerapan uap air dalam tanah Lembab Dingin Kering Dingin Kering Panas Lembab Panas
. Mekanisme Gerakan uap air. Difusi uap air terjadi dlm udara tanah, penggeraknya adalah perbedaan tekanan uap air. Arah gerapan menuju ke daerah dg tekanan uap rendah. Pengaruh suhu dan lengas tanah terhadap gerapan uap air dalam tanah. Lembab Dingin Kering Dingin. Kering Panas Lembab Panas.")
75
KAPASITAS RETENSI MAKSIMUM adalah:
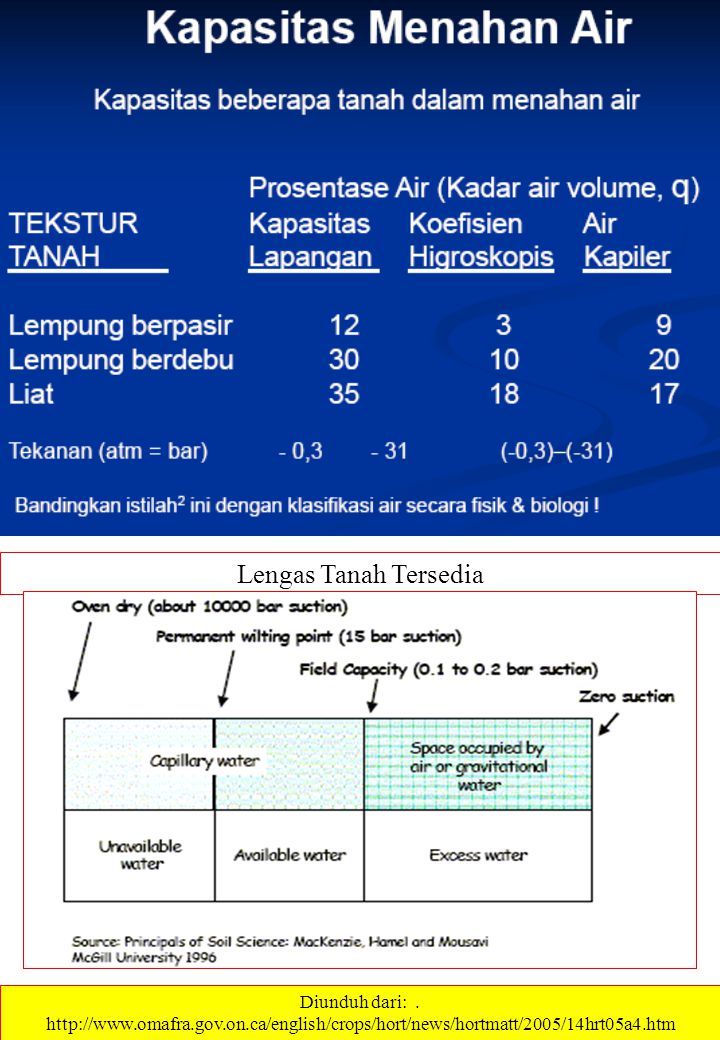
RETENSI AIR TANAH KAPASITAS RETENSI MAKSIMUM adalah: Kondisi tanah pada saat semua pori terisi penuh air, tanah jenuh air, dan tegangan matrik adalah nol. KAPASITAS LAPANG: air telah meninggalkan pori makro, mori makro berisi udara, pori mikro masih berisi air; tegangan matrik bar; pergerakan air terjadi pd pori mikro/ kapiler KOEFISIEN LAYU: siang hari tanaman layu dan malam hari segar kembali, lama-lama tanaman layu siang dan malam; tegangan matrik 15 bar. Air tanah hanya mengisi pori mikro yang terkecil saja, sebagian besar air tidak tersedia bagi tanaman. Titik layu permanen, bila tanaman tidak dapat segar kembali KOEFISIEN HIGROSKOPIS Molekul air terikat pada permukaan partikel koloid tanah, terikat kuat sehingga tidak berupa cairan, dan hanya dapat bergerak dlm bentuk uap air, tegangan matrik-nya sekitar 31 bar. Tanah yg kaya bahan koloid akan mampu menahan air higroskopis lebih banyak dp tanah yg miskin bahan koloidal. Klasifikasi lengas tanah Diunduh dari: .

76
Lengas Tanah Tersedia Diunduh dari: .
77
Status Air Tanah Perubahan status air dalam tanah, mulai dari kondisi jenuh hingga titik layu Jenuh Kap. Lapang Titik layu Padatan Pori 100g air g tanah jenuh air 100g g udara kapasitas lapang 100g g udara koefisien layu 100g g udara koefisien higroskopis

78
TEGANGAN & KADAR AIR PERHATIKANLAH proses yang terjadi kalau tanah basah dibiarkan mengering. Bagan berikut melukiskan hubungan antara tebal lapisan air di sekeliling partikel tanah dengan tegangan air Bidang singgung tanah dan air Koef Koef Kapasitas padatan tanah higroskopis layu lapang 10.000 atm 31 atm atm /3 atm atm Mengalir krn gravitasi Tegangan air 1/3 atm tebal lapisan air

79
TEGANGAN vs kadar air Kurva tegangan - kadar air tanah bertekstur lempung Air kapiler Air Air tersedia higros- kopis Lambat tersedia Cepat tersedia Air gravitasi Zone optimum Tegangan air, bar 31 Koefisien higroskopis Koefisien layu Kapasitas lapang Kap. Lapang maksimum persen air tanah

80
Klasifikasi Air Tanah Klasifikasi Fisik: 1. Air Bebas (drainase)
2. Air Kapiler 3. Air Higroskopis Air Bebas (Drainase): a. Air yang berada di atas kapasitas lapang b. Air yang ditahan tanah dg tegangan kurang dari atm c. Tidak diinginkan, hilang dengan drainase d. Bergerak sebagai respon thd tegangan dan tarika gravitasi bumi e. Hara tercuci bersamanya AIR KAPILER: a. Air antara kapasitas lapang dan koefisien higroskopis b. Tegangan lapisan air berkisar atm c. Tidak semuanya tersedia bagi tanaman d. Bergerak dari lapisan tebal ke lapisan tipis e. Berfungsi sebagai larutan tanah AIR HIGROSKOPIS : a. Air diikat pd koefisien higroskopis b. Tegangan berkisar antara atm c. Diikat oleh koloid tanah d. Sebagian besar bersifat non-cairan e. Bergerak sebagai uap air
: a. Air yang berada di atas kapasitas lapang. b. Air yang ditahan tanah dg tegangan kurang dari atm. c. Tidak diinginkan, hilang dengan drainase. d. Bergerak sebagai respon thd tegangan dan tarika gravitasi bumi. e. Hara tercuci bersamanya. AIR KAPILER: a. Air antara kapasitas lapang dan koefisien higroskopis. b. Tegangan lapisan air berkisar atm. c. Tidak semuanya tersedia bagi tanaman. d. Bergerak dari lapisan tebal ke lapisan tipis. e. Berfungsi sebagai larutan tanah. AIR HIGROSKOPIS : a. Air diikat pd koefisien higroskopis. b. Tegangan berkisar antara atm. c. Diikat oleh koloid tanah. d. Sebagian besar bersifat non-cairan. e. Bergerak sebagai uap air.")
81
Agihan air dalam tanah Berdasarkan tegangan air tanah dapat dibedakan menjadi tiga bagian: Air bebas, kapiler dan higroskopis Koef. Higroskopis Kap. Lapang Jml ruang pori kurang lebih 31 atm kurang lebih 1/3 atm Lapisan olah Air higros Air Kapiler Ruang diisi udara kopik Peka thd gerakan Biasanya jenuh uap air Hampir tdk kapiler, laju pe Setelah hujan lebat menunjukkan nyesuaian me sebagian diisi air, sifat cairan ningkat dg me tetapi air cepat hi- ningkatnya ke lang krn gravitasi lembaban tanah bumi Lapisan bawah tanah Karena pemadatan ruang pori berkurang Strata bawah (jenuh air) Kolom tanah Jumlah ruang pori
 Kolom tanah Jumlah ruang pori.")
82
Klasifikasi Biologi Air tanah
Klasifikasi berdasarkan ketersediaannya bagi tanaman: 1. AIR BERLEBIHAN: air bebas yg kurang tersedia bagi tanaman. Kalau jumlahnya banyak berdampak buruk bagi tanaman, aerasi buruk, akar kekurangan oksigen, anaerobik, pencucian air 2. AIR TERSEDIA: air yg terdapat antara kap. Lapang dan koef. Layu. Air perlu ditambahkan untuk mencapai pertumbuhan tanaman yang optimum apabila % air yg tersedia telah habis terpakai. Kalau air tanah mendekati koefisien layu, penyerapan air oleh akar tanaman tdk begitu cepat dan tidak mampu mengimbangi pertumbuhan tanaman 3. AIR TIDAK TERSEDIA: AIR yg diikat oleh tanah pd TITIK LAYU permanen, yaitu air higroskopis dan sebagian kecil air kapiler. KH KL KP % pori 31 atm atm /3 atm Air Air Ruang udara dan Higroskopis Kapiler air drainase Tdk tersedia Tersedia Berlebihan Daerah Optimum

83
Air Tersedia

84
Kapasitas retensi maksimum Potensial air tanah , kPa
Kadar A i r T anah % vo l Kapasitas retensi maksimum Kapasitas lapang Koef. higroskopis Koef. Layu Potensial air tanah , kPa

85
Kapasitas lapang Air tersedia Koefisien layu Air tidak tersedia
Kadar A i r T anah % vo l Kapasitas lapang Air tersedia Koefisien layu Air tidak tersedia Tekstur tanah

86
Faktor yg mempengaruhi Air Tersedia
Faktor yg berpengaruh: Hubungan tegangan dengan kelengasan Kedalaman tanah 3. Pelapisan Tanah TEGANGAN MATRIK : tekstur, struktur dan kandungan bahan organik mempengaruhi jumlah air yg dapat disediakan tanah bagi tanaman TEGANGAN OSMOTIK: adanya garam dalam tanah meningkatkan tegangan osmotik dan menurunkan jumlah air tersedia, yaitu menaikkan koefisien layu. Persen air Sentimeter air setiap 30 cm tanah 10 Kap. Lapang Air tersedia Koef. Layu 5 6 Air tidak tersedia Pasir Sandy loam Loam Silty-loam Clay-loam Liat Tekstur semakin halus

87
SUPLAI AIR ke TANAMAN Dua proses yg memungkinkan akar tanaman mampu menyerap air dlm jumlah banyak, yaitu: 1. Gerakan kapiler air tanah mendekati permukaan akar penyerap 2. Pertumbuhan akar ke arah zone tanah yang mengandung air LAJU GERAKAN KAPILER Bulu akar menyerap air Tegangan air tanah meningkat Jumlah air tanah berkurang Terjadi perbedaan Tegangan dg air tanah di sekitarnya Terjadi gerakan kapiler air menuju bulu akar Laju gerakan tgt perbedaan tegangan dan daya hantar pori tanah Gerakan kapiler 2.5 cm sagt penting LAJU PERPANJANGAN AKAR Selama masa pertumbuhan tanaman, akar tanaman tumbuh memanjang dengan cepat, sehingga luas permukaan akar juga tumbuh terus. Jumlah luas permukaan akar penyerap yang bersentuhan langsung dengan sebagian kecil air tanah (yaitu sekitar 1-2%)
")
88
KEHILANGAN UAP AIR DARI TANAH
HADANGAN HUJAN OLEH TUMBUHAN Tajuk tumbuhan mampu menangkap sejumlah air hujan, sebagian air ini diuapkan kembali ke atmosfer. Vegetasi hutan di daerah iklim basah mampu menguapkan kembali air hujan yg ditangkapnya hingga 25%, dan hanya 5% yg mencapai tanah melalui cabang dan batangnya. Awan hujan Pembentukan Awan presipitasi transpirasi evaporasi Run off infiltrasi Tanah permukaan perkolasi Groundwater Sungai - laut Batuan

89
Laju Infiltrasi Laju infiltrasi, cm/jam Konduktivitas hidraulik adalah
Merupakan fungsi dari:

90
KADAR AIR TANAH Hujan 1 jam Bidang pembasahan Hujan 3 jam Kedalaman
cm Bidang pembasahan Hujan 3 jam KADAR AIR TANAH

92
POTENSIAL GRAVITASI MEMPUNYAI NILAI POSITIF

93
Hadangan hujan oleh tanaman semusim
Sekitar % dari curah hujan dihadang tanaman dan dikembalikan ke atmosfer. Besarnya tergantung pada kesuburan tanaman dan stadia pertumbuhan tanaman . Dari curah hujan 375 mm, hanya sekitar mm yang mencapai tanah. Hadangan curah hujan oleh jagung dan kedelai Keadaan hujan Persen dari curah hujan total untuk: Jagung Kedelai Langsung ke tanah Melalui batang Jumlah di tanah Yang tinggal di atmosfer Sumber: J.L.Haynes, 1940.

94
Lingkaran Tanah-Air-Tanaman
LTAT mrpk sistem dinamik dan terpadu dimana air mengalir dari tempat dengan tegangan rendah menuju tempat dengan tegangan air tinggi. Air kembali ke atmosfer (evapo-transpirasi) Hilang melalui stomata daun (transpirasi) Air dikembalikan ke tanah melalui hujan dan irigasi Penguapan Serapan bulu akar
 Hilang melalui stomata daun (transpirasi) Air dikembalikan ke tanah melalui hujan dan irigasi. Penguapan. Serapan bulu akar.")
95
d. Lapisan bahan induk tanah: terdiri atas batuan induk tanah.
PROFIL TANAH Lapisan Olah ( cm): kaya bahan organik dan mengandung banyak akar hidup . Lapisan ini sering diolah dan warnanya kehitaman. Lapisan Olah dalam: mengandung lebih sedikit bahan organik dan lebih sedikit akar hidup. Warnanya lebih terang, seringkali kelabu dan kadangkala berbecak kekuningan atau kemerahan. c. Lapisan subsoil : sedikit bahan organik dan sedikit akar. Tidak terlalu penting bagi pertumbuhan tanaman . d. Lapisan bahan induk tanah: terdiri atas batuan induk tanah.
: kaya bahan organik dan mengandung banyak akar hidup . Lapisan ini sering diolah dan warnanya kehitaman. Lapisan Olah dalam: mengandung lebih sedikit bahan organik dan lebih sedikit akar hidup. Warnanya lebih terang, seringkali kelabu dan kadangkala berbecak kekuningan atau kemerahan. c. Lapisan subsoil : sedikit bahan organik dan sedikit akar. Tidak terlalu penting bagi pertumbuhan tanaman . d. Lapisan bahan induk tanah: terdiri atas batuan induk tanah.")
96
HUBUNGAN ENERGI LTTA: Atmosfer Daun Batang Akar Tnah
Perubahan tegangan air pd saat bergerak dari tanah melalui akar, batang, daun , ke atmosfer Atmosfer Daun Batang Akar Tnah Tanah berkadar air rendah Tanah berkadar air tinggi 500 300 100 25 20 15 10 5 Potensial negatif air (Tegangan air)
")
97
CEKAMAN AIR BAGI TANAMAN
Plant moisture stress (PMS) is a measure of the tension or pull of moisture through a vascular plant. Much like a straw, when the demand for moisture at the surface of leaves is high, moisture is drawn from the stomata. This creates a pull of water through the leaves, stem, and down to the roots, which draws water from the soil. Diunduh dari:
 is a measure of the tension or pull of moisture through a vascular plant. Much like a straw, when the demand for moisture at the surface of leaves is high, moisture is drawn from the stomata. This creates a pull of water through the leaves, stem, and down to the roots, which draws water from the soil. Diunduh dari:")
98
Tegangan Lengas Tanah -- Daya Hantar
Water will move through soils from areas of wet soil to areas of dry soil due to capillarity. Thus, water moves from areas of high soil potential (small negative number) to areas of low potential (large negative number). This movement is slow and becomes slower as the soil becomes drier. Wet soils have high HC while dry soils have low HC. Air replaces water in soil channels and blocks the flow of water. As water moves from the soil (-.3 to -15 bar), into the roots (-3 to -20), through the stem, into the leaves (-15 to -30)and through the leaf stomata to the air (-500), it moves from a high water potential (small negative number) to a low water potential (large negative number). The water potential in the air is related to its relative humidity and is always less (more negative) than the water potential in the soil. Plants can extract only the soil water that is in contact with their roots. Diunduh dari: ..
 to areas of low potential (large negative number). This movement is slow and becomes slower as the soil becomes drier. Wet soils have high HC while dry soils have low HC. Air replaces water in soil channels and blocks the flow of water. As water moves from the soil (-.3 to -15 bar), into the roots (-3 to -20), through the stem, into the leaves (-15 to -30)and through the leaf stomata to the air (-500), it moves from a high water potential (small negative number) to a low water potential (large negative number). The water potential in the air is related to its relative humidity and is always less (more negative) than the water potential in the soil. Plants can extract only the soil water that is in contact with their roots. Diunduh dari: ..")
99
PEMAKAIAN KONSUMTIF (PK)
Pemakaian Konsumtif merupakan jumlah kehilangan air melalui evaporasi dan transpirasi. Lazim digunakan sebagai ukuran dari seluruh air yg hilang dari tanaman melalui evapotranspirasi Ini merupakan angka-praktis untuk keperluan pengairan Dua faktor penting yg menentukan PK adalah: 1. KEDALAMAN PERAKARAN TANAMAN 2. FASE PERTUMBUHAN TANAMAN PK dapat berkisar cm atau lebih: 1. Daerah basah - semi arid dg irigasi: cm. 2. Daerah panas dan kering dg irigasi: cm. EVAPORASI vs TRANSPIRASI Faktor yg berpengaruh adalah: 1. Perbandingan luas tutupan tanaman thd luas tanah 2. Efisiensi pemakaian air berbagai tanaman 3. Perbandingan waktu tanaman berada di lapangan 4. Keadaan iklim Di daerah basah : EVAPORASI TRANSPIRASI Di daerah kering: 1. EVAPORASI % dari seluruh hujan yg jatuh 2. TRANSPIRASI % 3. RUN OFF 5% Diunduh dari: .

100
KURVA PELEPASAN LENGAS TANAH
Soil water release curve expressed as gravimetric water content, θg (kg kg- 1), versus natural log pore water tension head, ln(h) (hPa), where the open squares (□) indicate data and the solid line (vG Fit) indicates the fitted van Genuchten function . The S-value, Sgi (−), is the magnitude of the release curve slope at the inflection point. The water content and tension head at the inflection point are θgi and hi, respectively. The shape of the release curve is controlled primarily by structure pores for 0 ≤ h ≤ hi, and primarily by matrix pores for h > hi. The van Genuchten function fitting parameters were α = 0.1630 hPa− 1, n = and m = 0.2156, with saturated water content, θgs = 0.59 kg kg− 1, and residual water content, θgr = 0.001 kg kg− 1. The resulting Sgi, θgi and hi values were 0.092, 0.41 kg kg− 1, and 20.1 hPa, respectively. Use of indicators and pore volume-function characteristics to quantify soil physical quality W.D. Reynolds, , C.F. Drury, C.S. Tan, C.A. Fox, X.M. Yang. Geoderma. Volume 152, Issues 3–4, 15 September 2009, Pages 252–263
, versus natural log pore water tension head, ln(h) (hPa), where the open squares (□) indicate data and the solid line (vG Fit) indicates the fitted van Genuchten function . The S-value, Sgi (−), is the magnitude of the release curve slope at the inflection point. The water content and tension head at the inflection point are θgi and hi, respectively. The shape of the release curve is controlled primarily by structure pores for 0 ≤ h ≤ hi, and primarily by matrix pores for h > hi. The van Genuchten function fitting parameters were α = hPa− 1, n = and m = , with saturated water content, θgs = 0.59 kg kg− 1, and residual water content, θgr = kg kg− 1. The resulting Sgi, θgi and hi values were 0.092, 0.41 kg kg− 1, and 20.1 hPa, respectively. Use of indicators and pore volume-function characteristics to quantify soil physical quality. W.D. Reynolds, , C.F. Drury, C.S. Tan, C.A. Fox, X.M. Yang. Geoderma. Volume 152, Issues 3–4, 15 September 2009, Pages 252–263.")
101
WUE : Water Use Efficiency
WUE Produksi tanaman yg dapat dicapai dari pemakaian sejumlah air tersedia WUE dapat dinyatakan sbg: 1. Pemakaian konsumtif (dalam kg) setiap kg jaringan tanaman yg dihasilkan 2. Transpirasi (dalam kg) setiap kg jaringan tanaman yg dihasilkan ……… NISBAH TRANSPIRASI Jumlah air yg diperlukan untuk menghasilkan 1 kg bahan kering tanaman NISBAH TRANSPIRASI Untuk tanaman di daerah humid: , di daerah arid duakalinya Tanaman Nisbah Transpirasi Beans Jagung Peas Kentang Sumber: Lyon, Buckman dan Brady, 1952. Diunduh dari: .
 setiap kg jaringan tanaman yg dihasilkan. 2. Transpirasi (dalam kg) setiap kg jaringan tanaman yg dihasilkan ……… NISBAH TRANSPIRASI. Jumlah air yg diperlukan untuk menghasilkan 1 kg. bahan kering tanaman. NISBAH TRANSPIRASI. Untuk tanaman di daerah humid: , di daerah arid duakalinya. Tanaman Nisbah Transpirasi. Beans Jagung Peas Kentang Sumber: Lyon, Buckman dan Brady, Diunduh dari: .")
102
Chinese Journal of Rice Science. 2005, Vol. 19 Issue (2): 132-136
. Photosynthetic Rate and Water Use Efficiency of Leaves at Different Positions During Panicle Initiation Stage Under the System of Rice Intensification (SRI) LIN Xian-qing , ZHOU Wei-jun , ZHU De-feng , ZHANG Yu-ping , YANG Guo-hua Chinese Journal of Rice Science. 2005, Vol. 19 Issue (2): The super hybrid rice combinations, Liangyoupeijiu, Ⅱyou 7954 and Guodao 1 were used as experimental materials under different transplanting densities, to study the photosynthetic rate and water use efficiency of leaves at different positions during panicle initiation stage under the system of rice intensification. When the transplanting density was decreased from 1.95×10⁵ to 0.75×10⁵ hills/ha under the SRI, the leaf area index remained constant, and the light transmittance of canopy,the photosynthetic rate and water use efficiency of the 9th to 13th leaves increased, while the transpiration rate of the leaf, and the identical degree of heading decreased. Higher photosynthetic rate and water use efficiency were observed in the 9th and 10th leaves under low transplanting density. In the SRI experiments, the highest grain yield was attained at the transplanting density of 1.65×10⁵ hills/ha. Diunduh dari:
 LIN Xian-qing , ZHOU Wei-jun , ZHU De-feng , ZHANG Yu-ping , YANG Guo-hua. Chinese Journal of Rice Science. 2005, Vol. 19 Issue (2): The super hybrid rice combinations, Liangyoupeijiu, Ⅱyou 7954 and Guodao 1 were used as experimental materials under different transplanting densities, to study the photosynthetic rate and water use efficiency of leaves at different positions during panicle initiation stage under the system of rice intensification. When the transplanting density was decreased from 1.95×10⁵ to 0.75×10⁵ hills/ha under the SRI, the leaf area index remained constant, and the light transmittance of canopy,the photosynthetic rate and water use efficiency of the 9th to 13th leaves increased, while the transpiration rate of the leaf, and the identical degree of heading decreased. Higher photosynthetic rate and water use efficiency were observed in the 9th and 10th leaves under low transplanting density. In the SRI experiments, the highest grain yield was attained at the transplanting density of 1.65×10⁵ hills/ha. Diunduh dari:")
103
FAKTOR WUE Faktor yang mempengaruhi WUE: Iklim, Tanah, dan Hara
WUE tertinggi lazimnya terjadi pd tanaman yg berproduksi optimum; Adanya faktor pembatas pertumbuhan akan menurunkan WUE Nisbah evapo-transpirasi tanaman di lokasi yg mempunyai defisit kejenuhan dari atmosfer 800 Kentang Kacang polong 400 Jagung Defisit kejenuhan dari atmosfer (mm Hg) Jumlah air unt menghasilkan 1 ton bahan kering 30 Kadar air tanah rendah 15 Kadar air tanah tinggi Pupuk P, kg/ha 600
 Jumlah air unt menghasilkan 1 ton bahan kering. 30. Kadar air tanah rendah. 15. Kadar air tanah tinggi. 0 Pupuk P, kg/ha 600.")
104
Water-use efficiency in response to climate change: from leaf to ecosystem in a temperate steppe
SHULI NIU, XUERONG XING, ZHE ZHANG, JIANYANG XIA, XUHUI ZHOU, BING SONG, LINGHAO LI, SHIQIANG WAN. Global Change Biology. Volume 17, Issue 2, pages 1073–1082, February 2011 Water-use efficiency (WUE) has been recognized as an important characteristic of ecosystem productivity, which links carbon (C) and water cycling. However, little is known about how WUE responds to climate change at different scales. Here, we investigated WUE at leaf, canopy, and ecosystem levels under increased precipitation and warming from 2005 to 2008 in a temperate steppe in Northern China. We measured gross ecosystem productivity (GEP), net ecosystem CO2 exchange (NEE), evapotranspiration (ET), evaporation (E), canopy transpiration (Tc), as well as leaf photosynthesis (Pmax) and transpiration (Tl) of a dominant species to calculate canopy WUE (WUEc=GEP/T), ecosystem WUE (WUEgep=GEP/ET or WUEnee=NEE/ET) and leaf WUE (WUEl=Pmax/Tl). The results showed that increased precipitation stimulated WUEc, WUEgep and WUEnee by 17.1%, 10.2% and 12.6%, respectively, but decreased WUEl by 27.4%. Climate warming reduced canopy and ecosystem WUE over the 4 years but did not affect leaf level WUE. Across the 4 years and the measured plots, canopy and ecosystem WUE linearly increased, but leaf level WUE of the dominant species linearly decreased with increasing precipitation. The differential responses of canopy/ecosystem WUE and leaf WUE to climate change suggest that caution should be taken when upscaling WUE from leaf to larger scales. Our findings will also facilitate mechanistic understanding of the C–water relationships across different organism levels and in projecting the effects of climate warming and shifting precipitation regimes on productivity in arid and semiarid ecosystems. Diunduh dari:
 has been recognized as an important characteristic of ecosystem productivity, which links carbon (C) and water cycling. However, little is known about how WUE responds to climate change at different scales. Here, we investigated WUE at leaf, canopy, and ecosystem levels under increased precipitation and warming from 2005 to 2008 in a temperate steppe in Northern China. We measured gross ecosystem productivity (GEP), net ecosystem CO2 exchange (NEE), evapotranspiration (ET), evaporation (E), canopy transpiration (Tc), as well as leaf photosynthesis (Pmax) and transpiration (Tl) of a dominant species to calculate canopy WUE (WUEc=GEP/T), ecosystem WUE (WUEgep=GEP/ET or WUEnee=NEE/ET) and leaf WUE (WUEl=Pmax/Tl). The results showed that increased precipitation stimulated WUEc, WUEgep and WUEnee by 17.1%, 10.2% and 12.6%, respectively, but decreased WUEl by 27.4%. Climate warming reduced canopy and ecosystem WUE over the 4 years but did not affect leaf level WUE. Across the 4 years and the measured plots, canopy and ecosystem WUE linearly increased, but leaf level WUE of the dominant species linearly decreased with increasing precipitation. The differential responses of canopy/ecosystem WUE and leaf WUE to climate change suggest that caution should be taken when upscaling WUE from leaf to larger scales. Our findings will also facilitate mechanistic understanding of the C–water relationships across different organism levels and in projecting the effects of climate warming and shifting precipitation regimes on productivity in arid and semiarid ecosystems. Diunduh dari:")
105
Pengendalian Penguapan
MULSA & PENGELOLAAN Mulsa adalah bahan yg dipakai pd permukaan tanah untuk mengurangi penguapan air atau untuk menekan pertumbuhan gulma. Lazimnya mulsa spt itu digunakan untuk tanaman yang tidak memerlukan pengolahan tanah tambahan MULSA KERTAS & PLASTIK Bahan mulsa dihamparkan di permukaan tanah, diikat spy tdk terbang, dan tanaman tumbuh melalui lubang-lubang yg telah disiapkan Selama tanah tertutup mulsa, air tanah dapat diawetkan dan pertumbuhan gulma dikendalikan MULSA SISA TANAMAN Bahan mulsa berasal dari sisa tanaman yg ditanam sebelumnya, misalnya jerami padi, jagung, dan lainnya Bahan mulsa dipotong-potong dan disebarkan di permukaan tanah Cara WALIK DAMI sebelum penanaman kedelai gadu setelah padi sawah MULSA TANAH Pengolahan tanah Efektivitas mulsa tanah dalam konservasi air-tanah (mengendalikan evaporasi) masih diperdebatkan, hasil-hasil penelitian masih snagat beragam Diunduh dari: .
 masih diperdebatkan, hasil-hasil penelitian masih snagat beragam. Diunduh dari: .")
106
Water-use efficiency and nitrogen-use efficiency of C3-C4 intermediate species of Flaveria Juss. (Asteraceae) PATRICK J. VOGAN, ROWAN F. SAGE. Plant, Cell & Environment Volume 34, Issue 9, pages 1415–1430, September 2011 Plants using the C4 pathway of carbon metabolism are marked by greater photosynthetic water and nitrogen-use efficiencies (PWUE and PNUE, respectively) than C3 species, but it is unclear to what extent this is the case in C3-C4 intermediate species. In this study, we examined the PWUE and PNUE of 14 species of Flaveria Juss. (Asteraceae), including two C3, three C4 and nine C3-C4 species, the latter containing a gradient of C4-cycle activities (as determined by initial fixation of 14C into C-4 acids). We found that PWUE, PNUE, leaf ribulose 1·5-bisphosphate carboxylase/oxygenase (Rubisco) content and intercellular CO2 concentration in air (Ci) do not change gradually with C4-cycle activity. These traits were not significantly different between C3 species and C3-C4 species with less than 50% C4-cycle activity. C4-like intermediates with greater than 65% C4-cycle activity were not significantly different from plants with fully expressed C4 photosynthesis. These results indicate that a gradual increase in C4-cycle activity has not resulted in a gradual change in PWUE, PNUE, intercellular CO2 concentration and leaf Rubisco content towards C4 levels in the intermediate species. Rather, these traits arose in a stepwise manner during the evolutionary transition to the C4-like intermediates, which are contained in two different clades within Flaveria. Diunduh dari:
 than C3 species, but it is unclear to what extent this is the case in C3-C4 intermediate species. In this study, we examined the PWUE and PNUE of 14 species of Flaveria Juss. (Asteraceae), including two C3, three C4 and nine C3-C4 species, the latter containing a gradient of C4-cycle activities (as determined by initial fixation of 14C into C-4 acids). We found that PWUE, PNUE, leaf ribulose 1·5-bisphosphate carboxylase/oxygenase (Rubisco) content and intercellular CO2 concentration in air (Ci) do not change gradually with C4-cycle activity. These traits were not significantly different between C3 species and C3-C4 species with less than 50% C4-cycle activity. C4-like intermediates with greater than 65% C4-cycle activity were not significantly different from plants with fully expressed C4 photosynthesis. These results indicate that a gradual increase in C4-cycle activity has not resulted in a gradual change in PWUE, PNUE, intercellular CO2 concentration and leaf Rubisco content towards C4 levels in the intermediate species. Rather, these traits arose in a stepwise manner during the evolutionary transition to the C4-like intermediates, which are contained in two different clades within Flaveria. Diunduh dari:")
107
Olah Tanah vs Penguapan Air Tanah
Alasan pengolahan tanah: 1. Mempertahankan kondisi fisika tanah yg memuaskan 2. Membunuh gulma 3. Mengawetkan air tanah. Pengendalian Penguapan vs Pemberantasan Gulma Perlakuan Hasil jagung (t/ha) Kadar air tanah (%) hingga kedalaman 1 m Tanah dibajak dg persiapan yg baik 1. Dibebaskan dari gulma 2. Gulma dibiarkan tumbuh 3. Tiga kali pengolahan dangkal Persiapan Buruk 4. Dibebaskan dari gulma Sumber: Mosier dan Gutafson, 1915. Pengolahan tanah yg dapat mengendalikan gulma dan memperbaiki kondisi fisik tanah akan berdampak positif thd produksi tanaman Pengolahan tanah yg berlebihan dapat merusak akar tanaman dan merangsang evaporasi, shg merugikan tanaman Diunduh dari: .
 Kadar air tanah (%) hingga kedalaman 1 m. Tanah dibajak dg persiapan yg baik. 1. Dibebaskan dari gulma Gulma dibiarkan tumbuh Tiga kali pengolahan dangkal Persiapan Buruk. 4. Dibebaskan dari gulma Sumber: Mosier dan Gutafson, Pengolahan tanah yg dapat mengendalikan gulma dan memperbaiki kondisi fisik tanah akan berdampak positif thd produksi tanaman. Pengolahan tanah yg berlebihan dapat merusak akar tanaman dan merangsang evaporasi, shg merugikan tanaman. Diunduh dari: .")
108
Assessment of strip tillage systems for maize production in semi-arid Ethiopia: Effects on grain yield, water balance and water productivity Melesse Temesgen, H.H.G. Savenije, J. Rockström, W.B. Hoogmoed. Physics and Chemistry of the Earth, Parts A/B/C Available online 16 August 2011 Soil moisture has been monitored to a depth of 1.8 m using a Time Domain Reflectometer (TDR) while surface runoff has been measured using a specially designed rectangular trough installed at the bottom of each plot. STS resulted in the least surface runoff (Qs = 18 mm season−1) and the highest grain yields (Y = 2130 kg ha−1) followed by ST (Qs = 26 mm season−1, Y = 1840 kg ha−1) and CONV (Qs = 43 mm season−1, Y = 1720 kg ha−1) provided sowing was carried out within a week after subsoiling. Thus, STS resulted in the highest water productivity, WP = 0.60 kg m−3, followed by ST (WP = 0.52 kg m−3) and CONV (WP = 0.48 kg m−3). The main conclusion of the paper is that even in dry areas reasonable yields can be obtained provided moisture conservation in the root zone is guaranteed. In this regard subsoiling is essential. Moreover, it is concluded that the time between subsoiling and planting is a key factor and should not exceed one week. General overview of rainfall partitioning in farmers’ fields in semi-arid savannah agro ecosystems in sub-Saharan Africa. P = seasonal rainfall, ES = soil evaporation, T = plant transpiration, QS = surface runoff and R = deep percolation. (Adapted from: Rockström et al 2001). Diunduh dari:
 while surface runoff has been measured using a specially designed rectangular trough installed at the bottom of each plot. STS resulted in the least surface runoff (Qs = 18 mm season−1) and the highest grain yields (Y = 2130 kg ha−1) followed by ST (Qs = 26 mm season−1, Y = 1840 kg ha−1) and CONV (Qs = 43 mm season−1, Y = 1720 kg ha−1) provided sowing was carried out within a week after subsoiling. Thus, STS resulted in the highest water productivity, WP = 0.60 kg m−3, followed by ST (WP = 0.52 kg m−3) and CONV (WP = 0.48 kg m−3). The main conclusion of the paper is that even in dry areas reasonable yields can be obtained provided moisture conservation in the root zone is guaranteed. In this regard subsoiling is essential. Moreover, it is concluded that the time between subsoiling and planting is a key factor and should not exceed one week. General overview of rainfall partitioning in farmers’ fields in semi-arid savannah agro ecosystems in sub-Saharan Africa. P = seasonal rainfall, ES = soil evaporation, T = plant transpiration, QS = surface runoff and R = deep percolation. (Adapted from: Rockström et al 2001). Diunduh dari:")
109
Tillage and surface residue effects on evaporation from soils
Soil Science Society of America journal May/June v. 53 (3) Many crop growth models require modification for dryland farming systems because they do not predict an effect of residues on the soil water balance. Daily evaporation (E) from a Pullman clay loam (fine, mixed, thermic Torrertic Paleustoll) was measured in three experiments using laboratory cores or field microlysimeters to determine effects of tillage and residues on cumulative E and on E rate. The first experiment showed that the disk treatment had the highest rate of Stage 1 E and lower slope of the Stage 2 E curve than sweep and no-tillage treatments. Effects of tillage on surface wheat (Triticum aestivum L.) residues and on soil physical properties both seemed related to E. In a subsequent experiment, no effect of tillage-induced differences in soil properties on daily E was measured when wheat residues were removed before tillage. In the third experiment the effect of cotton (Gossypium hirsutum L.), sorghum [Sorghum bicolor (L.) Moench], or wheat residue (X, m3 m-2) on the initial, energy-limited rate of E (y, the potential E at the surface relative to bare soil E) was described by a logarithmic relationship [y = (In X), n = 36, r2 = 0.87]. With residues described on a mass/unit area basis, crop-specific curves were obtained; but with residues described on a thickness or volume/unit area basis, the curves obtained with the different crop residues were very similar to the pooled relationship given above. This simple relationship between residue level and daily E can be incorporated into water balances of commonly used crop growth models to increase the accuracy of water balance prediction for different cropping system. Diunduh dari: .
 Many crop growth models require modification for dryland farming systems because they do not predict an effect of residues on the soil water balance. Daily evaporation (E) from a Pullman clay loam (fine, mixed, thermic Torrertic Paleustoll) was measured in three experiments using laboratory cores or field microlysimeters to determine effects of tillage and residues on cumulative E and on E rate. The first experiment showed that the disk treatment had the highest rate of Stage 1 E and lower slope of the Stage 2 E curve than sweep and no-tillage treatments. Effects of tillage on surface wheat (Triticum aestivum L.) residues and on soil physical properties both seemed related to E. In a subsequent experiment, no effect of tillage-induced differences in soil properties on daily E was measured when wheat residues were removed before tillage. In the third experiment the effect of cotton (Gossypium hirsutum L.), sorghum [Sorghum bicolor (L.) Moench], or wheat residue (X, m3 m-2) on the initial, energy-limited rate of E (y, the potential E at the surface relative to bare soil E) was described by a logarithmic relationship [y = (In X), n = 36, r2 = 0.87]. With residues described on a mass/unit area basis, crop-specific curves were obtained; but with residues described on a thickness or volume/unit area basis, the curves obtained with the different crop residues were very similar to the pooled relationship given above. This simple relationship between residue level and daily E can be incorporated into water balances of commonly used crop growth models to increase the accuracy of water balance prediction for different cropping system. Diunduh dari: .")
110
EFFECTS OF PLOUGHLESS TILLAGE AND STRAW INCORPORATION ON EVAPORATION.
Rydberg, T. Journal Soil & Tillage Research 1990 Vol. 17 No. 3-4 pp The effects of stubble cultivation with a disc tiller or spring tine cultivator, or with both in combination, replacing mouldboard ploughing on evaporation were investigated using undisturbed soil lysimeters excavated after spring cultivation. The evaporation process was measured on ploughed and unploughed soil lysimeters both with or without precipitation and with or without a seedbed. The effects on evaporation of incorporating crop residues with or without precipitation into a ploughed seedbed were also measured. The results from a heavy clay and a silty clay loam showed that both ploughless tillage and incorporated straw reduced cumulative evaporation. The water-conserving effect was greater in irrigated treatments. The positive effect on water conservation was also greater on the silty clay loam than on the heavy clay. Soil structural changes brought about by these methods acted to reduce the rate of evaporation from soil. Diunduh dari: .

111
Tillage and Water Content Effects on Surface Soil Hydraulic Properties and Shortwave Albedo
H. P. Cresswell,* D. J. Painter, and K. C. Cameron Soil Sci. Soc. Am. J. 57: (1993). The modification of surface soil structure affects soil-water processes important in crop production and soil conservation. Effects of pretillage soil water content (PTSW) with multiple-pass tillage operations were determined on soil hydraulic properties and shortwave albedo on freshly tilled soil. Objectives included determination of whether PTSW can be used to improve management of seedbed hydraulic properties and whether tillage-induced soil surface conditions significantly affect albedo. Of the three tillage sequences (minimum, intermediate, and excess tillage) applied to a Templeton silt loam soil (mixed, mesic Udic Ustochrept), the excess tillage sequence resulted in the lowest macropore volume, mainly through a decrease in the volume of aeration pores (pores >300-ju.m diam.). The slope of the water characteristic between —1.0 and —1500 kPa matric potential was unaffected by tillage treatments. The excess tillage sequence resulted in a mean hydraulic conductivity (matric potential = —0.4 kPa ) of 11.1 cm h~', compared with 14.9 cm h~' following minimum tillage. Different PTSW did not cause significant differences in hydraulic properties of freshly tilled soil. The range of tillage-induced soil structures produced did affect shortwave albedo, but to a smaller extent than shown in some previous studies. Bare soil shortwave albedo variation with zenith angle appears soil specific; here a small decrease in albedo was observed as zenith angle increased. In this soil, with commonly practiced tillage sequences and a range of PTSW representative of field conditions, information about PTSW will not help manipulation of hydraulic properties and shortwave albedo in the fresh seedbed . Diunduh dari:
. The modification of surface soil structure affects soil-water processes. important in crop production and soil conservation. Effects of pretillage. soil water content (PTSW) with multiple-pass tillage operations. were determined on soil hydraulic properties and shortwave albedo. on freshly tilled soil. Objectives included determination of whether. PTSW can be used to improve management of seedbed hydraulic. properties and whether tillage-induced soil surface conditions significantly. affect albedo. Of the three tillage sequences (minimum, intermediate, and excess tillage) applied to a Templeton silt loam soil (mixed, mesic Udic Ustochrept), the excess tillage sequence resulted in the. lowest macropore volume, mainly through a decrease in the volume. of aeration pores (pores >300-ju.m diam.). The slope of the water characteristic between —1.0 and —1500 kPa matric potential was unaffected by tillage treatments. The excess tillage sequence resulted in a mean hydraulic conductivity (matric potential = —0.4 kPa ) of 11.1 cm h~ , compared with 14.9 cm h~ following minimum tillage. Different PTSW did not cause significant differences in hydraulic properties of freshly tilled soil. The range of tillage-induced soil structures produced did affect shortwave albedo, but to a smaller extent than shown in some previous studies. Bare soil shortwave albedo variation with zenith angle appears soil specific; here a small decrease in albedo was observed as zenith angle increased. In this soil, with commonly practiced tillage sequences and a range of PTSW representative of field conditions, information about PTSW will not help manipulation of hydraulic properties and shortwave albedo in the fresh seedbed . Diunduh dari:")
112
KIPAS KAPILER = Capillary rise
So far, it has been explained that water can move downward, as well as horizontally (or laterally). In addition, water can move upward. If a piece of tissue is dipped in water, the water is sucked upward by the tissue. The same process happens with a groundwater table and the soil above it. The groundwater can be sucked upward by the soil through very small pores that are called capillars. This process is called capillary rise. Model to assess water movement from a shallow water table to the root zone D Raes, P Deproost. Agricultural Water Management. Volume 62, Issue 2, 23 September 2003, Pages 79–91 Indicative values (full lines) for capillary rise to the root zone for various soil types and depths of the groundwater. The dotted line gives the capillary rise to a bare soil surface for soil type 2 (by assuming that the soil surface of the bare soil corresponds with the bottom of the root zone). Diunduh dari: .
. In addition, water can move upward. If a piece of tissue is dipped in water, the water is sucked upward by the tissue. The same process happens with a groundwater table and the soil above it. The groundwater can be sucked upward by the soil through very small pores that are called capillars. This process is called capillary rise. Model to assess water movement from a shallow water table to the root zone. D Raes, P Deproost. Agricultural Water Management. Volume 62, Issue 2, 23 September 2003, Pages 79–91. Indicative values (full lines) for capillary rise to the root zone for various soil types and depths of the groundwater. The dotted line gives the capillary rise to a bare soil surface for soil type 2 (by assuming that the soil surface of the bare soil corresponds with the bottom of the root zone). Diunduh dari: .")
113
Perched groundwater table
A perched groundwater layer can be found on top of an impermeable layer rather close to the surface (20 to 100 cm). It covers usually a limited area. The top of the perched water layer is called the perched groundwater table. The impermeable layer separates the perched groundwater layer from the more deeply located groundwater table. Diunduh dari: .
. It covers usually a limited area. The top of the perched water layer is called the perched groundwater table. The impermeable layer separates the perched groundwater layer from the more deeply located groundwater table. Diunduh dari: .")
114
Part of the water applied to the soil surface drains below the rootzone and feeds deeper soil layers which are permanently saturated; the top of the saturated layer is called groundwater table or sometimes just water table Diunduh dari: .

Presentasi serupa