Upload presentasi
Presentasi sedang didownload. Silahkan tunggu

1
EKO HIDROLOGI Oleh: Mas Agus Mardyanto Jurusan Teknik Lingkungan FTSP – ITS mardyanto@enviro.its.ac.id

2
HIDROLOGI

3
SCOPE Objective: Knowledge and concept about the importance of environmental studies in the calculation of surface and subsurface hydrology Students must have ability in implementing eco-hydrology concepts in design and environmental conservation Competence: Students are able to apply sustainability concepts in design and research related to ecology and hydrology

4
Literature Jurnal papers Fetter, C.W. (2001), Applied Hydrogeology, Prentice-Hall Inc, Upper-Saddle-River, New Jersey Davis, Allen P. & McCuen, Richard H. (2005), Stormwater Management for Smart Growth, Springer, New York Chow, V.T., Maidment, D.R., & Mays, L.W. (1988), Applied Hydrology, McGraw-Hill Book Company, Singapore Schnoor, Jerald L. (1996), Environmental Modelling, John Willey & Sons, New York
, Applied Hydrogeology, Prentice-Hall Inc, Upper-Saddle-River, New Jersey Davis, Allen P. & McCuen, Richard H. (2005), Stormwater Management for Smart Growth, Springer, New York Chow, V.T., Maidment, D.R., & Mays, L.W. (1988), Applied Hydrology, McGraw-Hill Book Company, Singapore Schnoor, Jerald L. (1996), Environmental Modelling, John Willey & Sons, New York.")
5
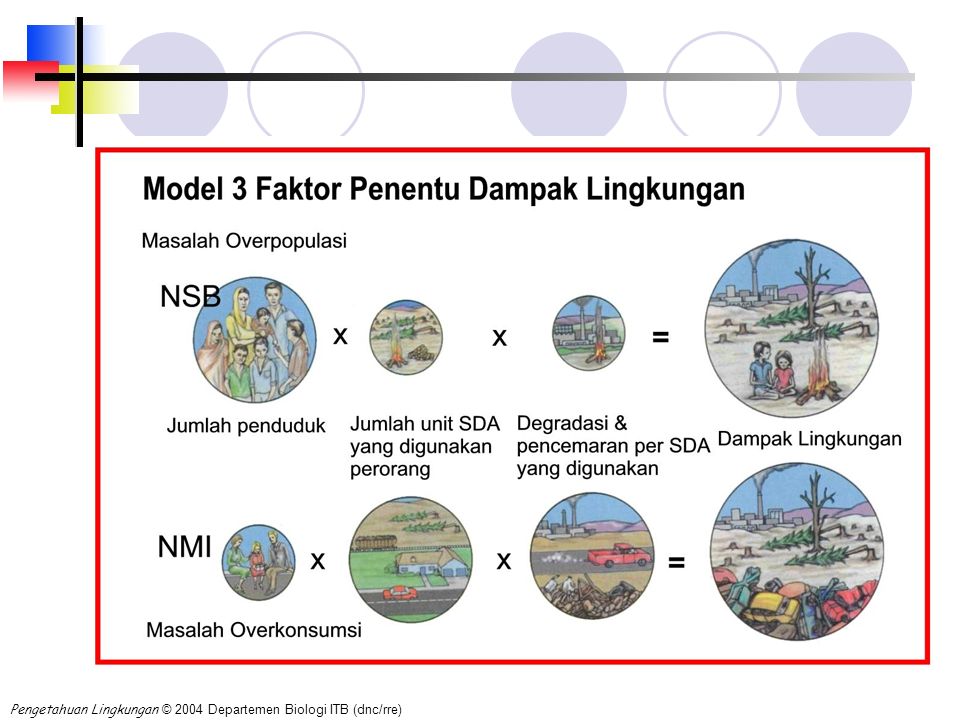
KETERKAITAN MASALAH LINGKUNGAN PEMBANGUNAN EKONOMI SELAMA INI CENDERUNG MENGEKSPLOITASI SUMBER DAYA ALAM DAN MENGAKIBATKAN KERUSAKAN LINGKUNGAN POPULASI MANUSIA Overpopulasi Overkonsumsi Penyebaran Kesenjangan NMI* & NSB** Krisis politik-ekonomi-sosial SUMBER DAYA ALAM Keterbatasan & kualitas/kondisi Pemborosan Anggapan bahwa teknologi dapat memecahkan semua masalah PENCEMARAN & KERUSAKAN LINGKUNGAN *NMI = Negara Maju Industri **NSB = Negara Sedang Berkembang Pengetahuan Lingkungan © 2004 Departemen Biologi ITB (dnc/rre) Ilustasi : Art Explosion® 1998
 Ilustasi : Art Explosion® 1998")
6
JENIS-JENIS SUMBER DAYA ALAM Sumber Daya Alam Sumber Daya Terbarui (Tidak Habis): mis. sumber daya matahari, angin, gelombang laut Sumber Daya Tidak Terbarui: mis. bahan bakar fosil, mineral logam & nonlogam Sumber Daya yang Berpotensi untuk Terbarui: mis. udara segar, air bersih, tumbuhan, hewan (keanekaragaman hayati) Ilustasi : Art Explosion® 1998 Pengetahuan Lingkungan © 2004 Departemen Biologi ITB (dnc/rre)
 Ilustasi : Art Explosion® 1998 Pengetahuan Lingkungan © 2004 Departemen Biologi ITB (dnc/rre).")
7
PENCEMARAN UDARA Perubahan iklim global Perusakan lapisan ozon Hujan asam Pencemaran udara daerah perkotaan dll. PENCEMARAN UDARA Perubahan iklim global Perusakan lapisan ozon Hujan asam Pencemaran udara daerah perkotaan dll. PENCEMARAN AIR Sedimentasi Bahan kimia beracun Agen biologis pembawa penyakit Tumpahan minyak Pencemaran panas dll. PENCEMARAN AIR Sedimentasi Bahan kimia beracun Agen biologis pembawa penyakit Tumpahan minyak Pencemaran panas dll. PRODUKSI LIMBAH Limbah padat Bahan berbahaya & beracun PRODUKSI LIMBAH Limbah padat Bahan berbahaya & beracun PENURUNAN KEANEKARAGAMAN HAYATI Perusakan habitat Kepunahan spesies PENURUNAN KEANEKARAGAMAN HAYATI Perusakan habitat Kepunahan spesies PENURUNAN KETERSEDIAAN PANGAN Perusakan & pengurangan luas lahan pertanian Penurunan air tanah Penggurunan Erosi tanah Pemiskinan zat hara Penggaraman tanah Penangkapan ikan yang berlebihan dll. PENURUNAN KETERSEDIAAN PANGAN Perusakan & pengurangan luas lahan pertanian Penurunan air tanah Penggurunan Erosi tanah Pemiskinan zat hara Penggaraman tanah Penangkapan ikan yang berlebihan dll. MASALAH UTAMA LINGKUNGAN PENURUNAN KETERSEDIAAN SUMBERDAYA ALAM LAINNYA Energi / bahan bakar Mineral tidak terbarui PENURUNAN KETERSEDIAAN SUMBERDAYA ALAM LAINNYA Energi / bahan bakar Mineral tidak terbarui (Sumber: Miller 2000, Ilustrasi: Art Explosion® 1998) Pengetahuan Lingkungan © 2004 Departemen Biologi ITB (dnc/rre)
 Pengetahuan Lingkungan © 2004 Departemen Biologi ITB (dnc/rre).")
9
Introduction Increase of population stress to environment Open space is decreasing Forest and open spaces change into built areas Development: clear trees & vegetation, Local topography is graded water-holding depressions are eliminated In urban areas, almost all surfaces are paved: Almost 100% water becomes runoff (Surabaya Drainage Mater Plan 2018 suggested runoff coefficient = 0,92)
")
10
Sprawl development: spread out carelessly in an unnatural manner and distributed or stretched out in an irregular distribution urban facilities are distributed spatially in a way that appears to be unplanned and non optimal from the perspective of the inhabitants of the community, the surrounding infrastructure, & the environment Sprawl development: due to the non- appropriateness of development The urban areas have doubled in spatial extent even though the population has increased very little, maybe even decreased

11
Characteristics of urban sprawl Development in sub-urban areas (low density development) increases to support the urban development increase the developed areas/ decrease the open areas per capita Clustered land development pattern expanses of open space separating clusters of high density residential and commercial development Low density development lack of accessibility, increases automobile usage, lesser mass transportation, transportation infrastructure increases Clustered land development pattern opposed to Low density development
 increases to support the urban development increase the developed areas/ decrease the open areas per capita Clustered land development pattern expanses of open space separating clusters of high density residential and commercial development Low density development lack of accessibility, increases automobile usage, lesser mass transportation, transportation infrastructure increases Clustered land development pattern opposed to Low density development")
12
Transportation infrastructure contributes 50% imperviousness (most cause of urban sprawl) length of road per capita Increase of industries: Point source pollution (some are treated) Inhabitants, roads, agriculture areas: Non-point source pollution (untreated) Impact: Lesser infiltration Increase of runoff Decrease of groundwater recharge Environmental pollution: in-stream ecosystem is unable to cope with the increased loads of pollutants SMART GROWTH IS IMPORTANT
 length of road per capita Increase of industries: Point source pollution (some are treated) Inhabitants, roads, agriculture areas: Non-point source pollution (untreated) Impact: Lesser infiltration Increase of runoff Decrease of groundwater recharge Environmental pollution: in-stream ecosystem is unable to cope with the increased loads of pollutants SMART GROWTH IS IMPORTANT")
13
WHAT IS SMART GROWTH Comprehensive land use planning Density of development Cluster development is more favorable than single family units Cluster development causes: More mass transit layout Best environmental management practices More open space Less pressure to small headwater stream Small area of paved roadways, narrower streets Fewer sidewalks, shorter pedestrian walkways to transit depots More effective parking lots (used more frequently)
")
14
Lesser transportation trips Loss of natural storage can be reduced Any loss of natural storage must be replaced where possible In-stream pond storage can be eliminated by practicing natural storage, such as bio-retention or on-site extended detention On-site storage is preferable than off-site to prevent for dispersal of pollutants Put some vegetated buffer strips in planning processes, to reduce the dispersion of pollutant to streams Used of pipe system in any development Grass swales provide alternate conveyance pathways

15
Assignment 1.Look around at the development in your neighborhood. Describe the land use & how it relates to stormwater management. 2.If it rains on the roof of your building, where does the water go? Does it stay on the property of your residence, or is it directed elsewhere? 3.Locate a small stream in your locality. Follow the stream for a half of a km and note the land uses that drain into the stream. Specifically examine parts of the stream where the cross-sectional configuration changes, such as a wider bottom or shallower sides. Notes changes in the contributing watershed at those points. 4.Look at the storm drains on your street or in a nearby neighborhood. What is the source of the water entering the inlets (e.g. local driveways)? Is a stormwater management practice such as a pond located in the neighborhood?
. Is a stormwater management practice such as a pond located in the neighborhood .")
16
5.In your immediate locality, identify a cluster of houses, an apartment complex, a small shopping or strip mall, a public school, and a large shopping district. For each of these, estimate the fractions of impervious cover and parking space. Discuss the results as they relate to the amount of runoff expected. 6.Obtain an article from a local newspaper or magazine that discusses some aspect of urban/suburban sprawl. Analyze the article on the basis of factors such as the scale of the assessment (e.g. individual lot, neighborhood, watershed), the problem (e.g. water quality or water quantity), recommended solutions, or the role of modeling 7.Perform the analysis of Problem 6 using an article from a professional journal 8.Obtain definitions of bias, precision, and accuracy, as they relate to the modeling from a dictionary and from books of statistics. Interpret the definitions as they relate to the models for predicting the concentration of water quality parameter. 9.Obtain an article from a professional journal that describe the development of a water quality model, either a simple regression model or a more detailed conceptual model. Assess the way that the model was evaluated for accuracy, including the criteria, the methods (i.e. graphical, statistical), and the results
, the problem (e.g. water quality or water quantity), recommended solutions, or the role of modeling 7.Perform the analysis of Problem 6 using an article from a professional journal 8.Obtain definitions of bias, precision, and accuracy, as they relate to the modeling from a dictionary and from books of statistics. Interpret the definitions as they relate to the models for predicting the concentration of water quality parameter. 9.Obtain an article from a professional journal that describe the development of a water quality model, either a simple regression model or a more detailed conceptual model. Assess the way that the model was evaluated for accuracy, including the criteria, the methods (i.e. graphical, statistical), and the results.")
Presentasi serupa

 Anything needed by an organism or group of organism. Something useful (but for humanity what is useful or useless can change because.>")


 dan Pembelajaran Konvensional.>")
 2. Mahasiswa mampu memahami metode membaca.>")


 Pertemuan 14 Matakuliah: L0104 / Statistika Psikologi Tahun : 2008.>")

>")


>")


