Upload presentasi
Presentasi sedang didownload. Silahkan tunggu

1
Dosen : Muchdie, PhD in Economics PhD in Economics, 1998, Dept. of Economics, The University of Queensland, Australia. Post Graduate Diploma in Regional Dev.,1994, Dept. of Economics, The Univ. of Queensland, Australia. MS in Rural & Regional Development Planning, 1986, Graduate School, Bogor Agricultural University, Bogor

2
Peramalan Kualitatif : Survei & Jajak Pendapat Peramalan Kuantitatif : Analisis Deret Waktu Peramalan Kuantitatif : Teknik Penghalusan Peramalan Kuantitatif : Metode Barometrik Peramalan Kuantitatif : Model Ekonometrik Peramalan Kuantitatif : Peramalan Input- Output Ringkasan, Pertanyaan Diskusi, Soal-Soal dan Alamat Situs Internet Studi Kasus Gabungan 2 : Mengestimasi dan Meramalkan Permintaan Listrik di Amerika Serikat

3
Survey Techniques Planned Plant and Equipment Spending Expected Sales and Inventory Changes Consumers’ Expenditure Plans Opinion Polls Business Executives Sales Force Consumer Intentions

4
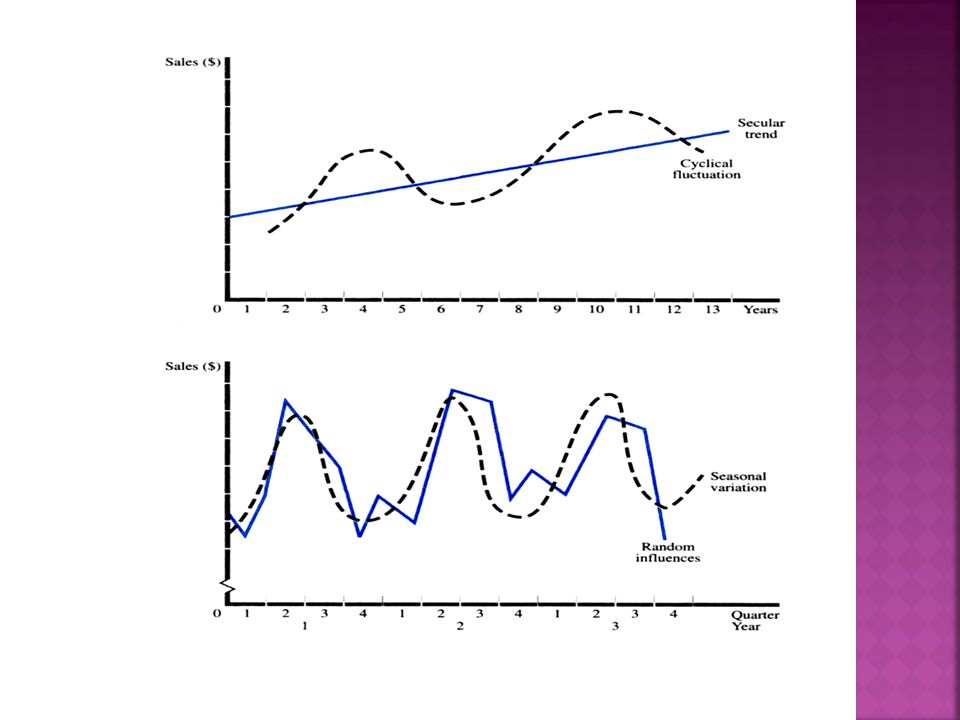
Secular Trend Long-Run Increase or Decrease in Data Cyclical Fluctuations Long-Run Cycles of Expansion and Contraction Seasonal Variation Regularly Occurring Fluctuations Irregular or Random Influences

6
Linear Trend: S t = S 0 + b t b = Growth per time period Constant Growth Rate S t = S 0 (1 + g) t g = Growth rate Estimation of Growth Rate lnS t = lnS 0 + t ln(1 + g)
 t g = Growth rate Estimation of Growth Rate lnS t = lnS 0 + t ln(1 + g)")
7
Ratio to Trend Method Actual Trend Forecast Ratio = Seasonal Adjustment = Average of Ratios for Each Seasonal Period Adjusted Forecast = Trend Forecast Seasonal Adjustment

8
Ratio to Trend Method: Example Calculation for Quarter 1 Trend Forecast for 1996.1 = 11.90 + (0.394)(17) = 18.60 Seasonally Adjusted Forecast for 1996.1 = (18.60)(0.8869) = 16.50
(17) = Seasonally Adjusted Forecast for = (18.60)(0.8869) = 16.50")
9
Forecast is the average of data from w periods prior to the forecast data point.

10
Forecast is the weighted average of of the forecast and the actual value from the prior period.

11
Measures the Accuracy of a Forecasting Method

12
National Bureau of Economic Research Department of Commerce Leading Indicators Lagging Indicators Coincident Indicators Composite Index Diffusion Index

13
Single Equation Model of the Demand For Cereal (Good X) Q X = a 0 + a 1 P X + a 2 Y + a 3 N + a 4 P S + a 5 P C + a 6 A + e Q X = Quantity of X P X = Price of Good X Y = Consumer Income N = Size of Population P S = Price of Muffins P C = Price of Milk A = Advertising e = Random Error
 Q X = a 0 + a 1 P X + a 2 Y + a 3 N + a 4 P S + a 5 P C + a 6 A + e Q X = Quantity of X P X = Price of Good X Y = Consumer Income N = Size of Population P S = Price of Muffins P C = Price of Milk A = Advertising e = Random Error")
14
Multiple Equation Model of GNP Reduced Form Equation

15
Three-Sector Input-Output Flow Table

16
Direct Requirements Matrix Direct Requirements Input Requirements Column Total =

17
Total Requirements Matrix

18
= Final Demand Vector Total Demand Vector

19
Revised Input-Output Flow Table

20
Pertanyaan Diskusi : Setiap mahasiswa memilih 2 (dua) nomor pertanyaan untuk dijawab secara tertulis. Hanya satu nomor pertanyaan yang boleh sama dengan mahasiswa lainnya. Jawaban dipresentasikan pada pertemuan berikut. Soal-soal : Setiap mahasiswa memilih 2 nomor soal dari Soal- soal nomor 1 – 14 untuk dijawab secara tertulis. Hanya satu nomor soal yang boleh sama dengan mahasiswa lainnya. Jawaban ditulis pada sebuah Buku Tulis yang dikumpulkan pada saat UTS.

Presentasi serupa
>")


 Program Pascasarjana-UHAMKA PhD in Economics, 1998, Dept.>")


>")

>")
>")

 (1)>")
>")
>")


>")
