Upload presentasi
Presentasi sedang didownload. Silahkan tunggu

1
Analisis Sifat Fisik TEXTURE ANALYSIS Nugraha Edhi Suyatma
Department of Food Science and Technology Bogor Agricultural University

2
Importance of Texture The importance of texture in the overall acceptability of foods varies widely, depending upon the type of food. We could arbitrarily break it into three groups: Critical: Foods in which texture is the dominant quality characteristic; for example, meat, potato chips, cornflakes and celery. Important: Foods in which texture makes a significant but not a dominant contribution to the overall quality, contributing, more or less equally, with flavor and appearance; for example, most fruits, vegetables, cheeses, bread, most other cereal-based foods and candy fall into this category. Minor: Foods in which texture makes a negligible contribution to the overall quality; examples are most beverages and thin soups.

4
Relations Between Textural Parameters and Popular Nomenclature

5
Understanding Stress and Strain
Stress: the intensity of force components (pressure or mechanical action) acting on a body, expressed as force (F) per unit area (A) of food material (consider pressure or mechanical action as stress) Strain: change in size or shape of a body in response to the applied stress, non-dimensional parameter. Reported as a ratio or percentage of the change to the original size or shape.
 acting on a body, expressed as force (F) per unit area (A) of food material (consider pressure or mechanical action as stress) Strain: change in size or shape of a body in response to the applied stress, non-dimensional parameter. Reported as a ratio or percentage of the change to the original size or shape.")
6
Type of stress Compressive (directed toward the material)
Compression Tensile Compressive (directed toward the material) Tensile (directed away from the material) Shearing (directed tangentially to the material) Shear
 Tensile (directed away from the material) Shearing (directed tangentially to the material) Shear.")
7
Analisis Tekstur

8
Alat Pengukur tekstur dan kurvanya Instron Universal Testing Machine

9
Texture Analyzer (Stable micro systems)
")
10
Texture Analyzer (Stable micro systems)
Needle: pengukuran firmness (buah, cake, keju, dll)
")
11
Texture Analyzer (Stable micro systems)
SPHERICAL: pengukuran freshness (cake, cheese)
")
12
Texture Analyzer (Stable micro systems)
CONICAL: pengukuran spreadability (butter, margarine)
")
13
Texture Analyzer (Stable micro systems)
CYLINDER: index of hardness, firmness or yieldpoint (gels, pectins, yoghurts, margarine)
")
14
VIDEO Aplikasi Texture Analyzer Pengukuran bloom strength

15
VIDEO Texture Analyzer Hardness and stickeness of chewy candy

16
Texture Analyzer (Stable micro systems)
Pengujian sealing tutup pot yoghurt

17
VIDEO: Food Texture Analysis

20
Texture Profile Analysis

21
TPA - The History General Foods texturometer developed
Force/time plot became known as a texture profile Szczesniak defined specific terms which correlated well with sensory panel scores - texture profile analysis

22
TPA - The History simulasi pada saat proses pengunyahan
Dengan memberikan gaya tekan (compression) terhadap produk sebanyak dua kali. Dapat diukur: Kekerasan (hardness) Elastisitas (elasticity) Kerapuhan (fracturability atau brittleness) Cohesiveness Daya kunyah (chewiness) Kelengketan (gumminess/stickiness)
 terhadap produk sebanyak dua kali. Dapat diukur: Kekerasan (hardness) Elastisitas (elasticity) Kerapuhan (fracturability atau brittleness) Cohesiveness. Daya kunyah (chewiness) Kelengketan (gumminess/stickiness)")
23
Texture Profile Analysis
Parameter reologi Cara menentukan Kekerasan Hardness Ditentukan dari maksimum gaya (nilai puncak) pada tekanan/ kompresi pertama. Kerapuhan (fracturability/ brittleness) Ditentukan dari puncak yang pertama kali terbaca pada tekanan yang pertama. Elastisitas (springiness) Untuk menentukan seberapa besar produk dapat kembali ke kondisi semula setelah diberikan tekanan pertama. Ditentukan dari jarak yang ditempuh oleh produk pada tekanan kedua sehingga tercapai nilai gaya maksimumnya (L2) dibandingkan dengan jarak yang ditempuh oleh produk pada tekanan pertama sehingga tercapai nilai gaya maksimumnya (L1) atau L2/L1 Daya kohesif (cohesiveness) Dihitung dari luasan di bawah kurva pada tekanan kedua (A2) dibagi dengan luasan di bawah kurva pada tekanan pertama (A1) atau A2/A1. Kelengketan (gumminess/ stickiness) Hanya dapat diamati pada produk semi-padat. Dihitung dari nilai kekerasan dikalikan dengan daya kohesif atau A2/A1*kekerasan Daya kunyah (chewiness) Hanya dapat diamati pada produk yang padat. Dihitung dari hasil perkalian nilai kelengketan dengan elastisitas, atau L2/L1*kelengketan
 pada tekanan/ kompresi pertama. Kerapuhan (fracturability/ brittleness) Ditentukan dari puncak yang pertama kali terbaca pada tekanan yang pertama. Elastisitas (springiness) Untuk menentukan seberapa besar produk dapat kembali ke kondisi semula setelah diberikan tekanan pertama. Ditentukan dari jarak yang ditempuh oleh produk pada tekanan kedua sehingga tercapai nilai gaya maksimumnya (L2) dibandingkan dengan jarak yang ditempuh oleh produk pada tekanan pertama sehingga tercapai nilai gaya maksimumnya (L1) atau L2/L1. Daya kohesif (cohesiveness) Dihitung dari luasan di bawah kurva pada tekanan kedua (A2) dibagi dengan luasan di bawah kurva pada tekanan pertama (A1) atau A2/A1. Kelengketan (gumminess/ stickiness) Hanya dapat diamati pada produk semi-padat. Dihitung dari nilai kekerasan dikalikan dengan daya kohesif atau A2/A1*kekerasan. Daya kunyah (chewiness) Hanya dapat diamati pada produk yang padat. Dihitung dari hasil perkalian nilai kelengketan dengan elastisitas, atau L2/L1*kelengketan.")
24
TPA (TEXTURE PROFILE ANALYSIS)
Known as the “two bite test” Provides textural parameters which correlate well with sensory evaluation parameters I’ll now move onto TPA (or Texture Profile Analysis) which is a common test and uses the principles of compression. It is known as an imatative test as it attempts to imitate the action of the jaw by compressing the sample piece twice in a reciprocating motion and for this reason it is often called the “Two Bite Test”. This point indicates the beginning of the first compression and here is the beginning of the second compression cycle. The force-time curve obtained from this then provides the user with a number of textural parameters that are known to correlate well with sensory evaluation parameters. A typical curve may look similar to this one here.
 which is a common test and uses the principles of compression. It is known as an imatative test as it attempts to imitate the action of the jaw by compressing the sample piece twice in a reciprocating motion and for this reason it is often called the Two Bite Test . This point indicates the beginning of the first compression and here is the beginning of the second compression cycle. The force-time curve obtained from this then provides the user with a number of textural parameters that are known to correlate well with sensory evaluation parameters. A typical curve may look similar to this one here.")
25
TPA (TEXTURE PROFILE ANALYSIS)
FIRST BITE Known as the “two bite test” Provides textural parameters which correlate well with sensory evaluation parameters FORCE I’ll now move onto TPA (or Texture Profile Analysis) which is a common test and uses the principles of compression. It is known as an imatative test as it attempts to imitate the action of the jaw by compressing the sample piece twice in a reciprocating motion and for this reason it is often called the “Two Bite Test”. This point indicates the beginning of the first compression and here is the beginning of the second compression cycle. The force-time curve obtained from this then provides the user with a number of textural parameters that are known to correlate well with sensory evaluation parameters. A typical curve may look similar to this one here. TIME
 which is a common test and uses the principles of compression. It is known as an imatative test as it attempts to imitate the action of the jaw by compressing the sample piece twice in a reciprocating motion and for this reason it is often called the Two Bite Test . This point indicates the beginning of the first compression and here is the beginning of the second compression cycle. The force-time curve obtained from this then provides the user with a number of textural parameters that are known to correlate well with sensory evaluation parameters. A typical curve may look similar to this one here. TIME.")
26
TPA (TEXTURE PROFILE ANALYSIS)
SECOND BITE Known as the “two bite test” Provides textural parameters which correlate well with sensory evaluation parameters FORCE I’ll now move onto TPA (or Texture Profile Analysis) which is a common test and uses the principles of compression. It is known as an imatative test as it attempts to imitate the action of the jaw by compressing the sample piece twice in a reciprocating motion and for this reason it is often called the “Two Bite Test”. This point indicates the beginning of the first compression and here is the beginning of the second compression cycle. The force-time curve obtained from this then provides the user with a number of textural parameters that are known to correlate well with sensory evaluation parameters. A typical curve may look similar to this one here. TIME
 which is a common test and uses the principles of compression. It is known as an imatative test as it attempts to imitate the action of the jaw by compressing the sample piece twice in a reciprocating motion and for this reason it is often called the Two Bite Test . This point indicates the beginning of the first compression and here is the beginning of the second compression cycle. The force-time curve obtained from this then provides the user with a number of textural parameters that are known to correlate well with sensory evaluation parameters. A typical curve may look similar to this one here. TIME.")
27
TPA (TEXTURE PROFILE ANALYSIS)
Movement of the Probe Force Here is a diagram of the procedure in more detail. From this you can see that on the first compression (or bite) the hardness is determined as the height of the peak force. For samples which are quite brittle the force is seen to have a significant peak in the curve on the first bite which is not present in, for instance, the testing of gels. On the upstroke of the compression probe the force is released and an adhesive value may be obtained depending on the degree of adhesion (or stickiness) of the sample to the probe, for instance in some gels. The distance over which this adhesion takes place is an indication of the stringiness of the product (for instance chewing gum would possess a greater degree of stringiness than would a sample of cream cheese. The springiness (or elasticity) is obtained on the second bite within the duration of the downstroke and gives an indication of the elastic recovery of the sample. Several other textural parameters can also be obtained such as gumminess, chewiness and cohesivess which are calculated from data using the following inbuilt formulae. All of these values are obtained in less than a second by the pressing of two buttons as soon as the test is finished, so you can see that it is a useful test and provides textural values without need for calculations (and actually makes people think you’ve done a lot of work). o Time
 the hardness is determined as the height of the peak force. For samples which are quite brittle the force is seen to have a significant peak in the curve on the first bite which is not present in, for instance, the testing of gels. On the upstroke of the compression probe the force is released and an adhesive value may be obtained depending on the degree of adhesion (or stickiness) of the sample to the probe, for instance in some gels. The distance over which this adhesion takes place is an indication of the stringiness of the product (for instance chewing gum would possess a greater degree of stringiness than would a sample of cream cheese. The springiness (or elasticity) is obtained on the second bite within the duration of the downstroke and gives an indication of the elastic recovery of the sample. Several other textural parameters can also be obtained such as gumminess, chewiness and cohesivess which are calculated from data using the following inbuilt formulae. All of these values are obtained in less than a second by the pressing of two buttons as soon as the test is finished, so you can see that it is a useful test and provides textural values without need for calculations (and actually makes people think you’ve done a lot of work). o. Time.")
28
TPA (TEXTURE PROFILE ANALYSIS)
Movement of the PROBE Force Here is a diagram of the procedure in more detail. From this you can see that on the first compression (or bite) the hardness is determined as the height of the peak force. For samples which are quite brittle the force is seen to have a significant peak in the curve on the first bite which is not present in, for instance, the testing of gels. On the upstroke of the compression probe the force is released and an adhesive value may be obtained depending on the degree of adhesion (or stickiness) of the sample to the probe, for instance in some gels. The distance over which this adhesion takes place is an indication of the stringiness of the product (for instance chewing gum would possess a greater degree of stringiness than would a sample of cream cheese. The springiness (or elasticity) is obtained on the second bite within the duration of the downstroke and gives an indication of the elastic recovery of the sample. Several other textural parameters can also be obtained such as gumminess, chewiness and cohesivess which are calculated from data using the following inbuilt formulae. All of these values are obtained in less than a second by the pressing of two buttons as soon as the test is finished, so you can see that it is a useful test and provides textural values without need for calculations (and actually makes people think you’ve done a lot of work). o DOWN Time ‘COMPRESSION’
 the hardness is determined as the height of the peak force. For samples which are quite brittle the force is seen to have a significant peak in the curve on the first bite which is not present in, for instance, the testing of gels. On the upstroke of the compression probe the force is released and an adhesive value may be obtained depending on the degree of adhesion (or stickiness) of the sample to the probe, for instance in some gels. The distance over which this adhesion takes place is an indication of the stringiness of the product (for instance chewing gum would possess a greater degree of stringiness than would a sample of cream cheese. The springiness (or elasticity) is obtained on the second bite within the duration of the downstroke and gives an indication of the elastic recovery of the sample. Several other textural parameters can also be obtained such as gumminess, chewiness and cohesivess which are calculated from data using the following inbuilt formulae. All of these values are obtained in less than a second by the pressing of two buttons as soon as the test is finished, so you can see that it is a useful test and provides textural values without need for calculations (and actually makes people think you’ve done a lot of work). o. DOWN. Time. ‘COMPRESSION’")
29
TPA (TEXTURE PROFILE ANALYSIS)
Movement of the PROBE Force Here is a diagram of the procedure in more detail. From this you can see that on the first compression (or bite) the hardness is determined as the height of the peak force. For samples which are quite brittle the force is seen to have a significant peak in the curve on the first bite which is not present in, for instance, the testing of gels. On the upstroke of the compression probe the force is released and an adhesive value may be obtained depending on the degree of adhesion (or stickiness) of the sample to the probe, for instance in some gels. The distance over which this adhesion takes place is an indication of the stringiness of the product (for instance chewing gum would possess a greater degree of stringiness than would a sample of cream cheese. The springiness (or elasticity) is obtained on the second bite within the duration of the downstroke and gives an indication of the elastic recovery of the sample. Several other textural parameters can also be obtained such as gumminess, chewiness and cohesivess which are calculated from data using the following inbuilt formulae. All of these values are obtained in less than a second by the pressing of two buttons as soon as the test is finished, so you can see that it is a useful test and provides textural values without need for calculations (and actually makes people think you’ve done a lot of work). o DOWN Time ‘COMPRESSION’
 the hardness is determined as the height of the peak force. For samples which are quite brittle the force is seen to have a significant peak in the curve on the first bite which is not present in, for instance, the testing of gels. On the upstroke of the compression probe the force is released and an adhesive value may be obtained depending on the degree of adhesion (or stickiness) of the sample to the probe, for instance in some gels. The distance over which this adhesion takes place is an indication of the stringiness of the product (for instance chewing gum would possess a greater degree of stringiness than would a sample of cream cheese. The springiness (or elasticity) is obtained on the second bite within the duration of the downstroke and gives an indication of the elastic recovery of the sample. Several other textural parameters can also be obtained such as gumminess, chewiness and cohesivess which are calculated from data using the following inbuilt formulae. All of these values are obtained in less than a second by the pressing of two buttons as soon as the test is finished, so you can see that it is a useful test and provides textural values without need for calculations (and actually makes people think you’ve done a lot of work). o. DOWN. Time. ‘COMPRESSION’")
30
TPA (TEXTURE PROFILE ANALYSIS)
Movement of the PROBE UP Force Here is a diagram of the procedure in more detail. From this you can see that on the first compression (or bite) the hardness is determined as the height of the peak force. For samples which are quite brittle the force is seen to have a significant peak in the curve on the first bite which is not present in, for instance, the testing of gels. On the upstroke of the compression probe the force is released and an adhesive value may be obtained depending on the degree of adhesion (or stickiness) of the sample to the probe, for instance in some gels. The distance over which this adhesion takes place is an indication of the stringiness of the product (for instance chewing gum would possess a greater degree of stringiness than would a sample of cream cheese. The springiness (or elasticity) is obtained on the second bite within the duration of the downstroke and gives an indication of the elastic recovery of the sample. Several other textural parameters can also be obtained such as gumminess, chewiness and cohesivess which are calculated from data using the following inbuilt formulae. All of these values are obtained in less than a second by the pressing of two buttons as soon as the test is finished, so you can see that it is a useful test and provides textural values without need for calculations (and actually makes people think you’ve done a lot of work). o Time ‘Decompression’
 the hardness is determined as the height of the peak force. For samples which are quite brittle the force is seen to have a significant peak in the curve on the first bite which is not present in, for instance, the testing of gels. On the upstroke of the compression probe the force is released and an adhesive value may be obtained depending on the degree of adhesion (or stickiness) of the sample to the probe, for instance in some gels. The distance over which this adhesion takes place is an indication of the stringiness of the product (for instance chewing gum would possess a greater degree of stringiness than would a sample of cream cheese. The springiness (or elasticity) is obtained on the second bite within the duration of the downstroke and gives an indication of the elastic recovery of the sample. Several other textural parameters can also be obtained such as gumminess, chewiness and cohesivess which are calculated from data using the following inbuilt formulae. All of these values are obtained in less than a second by the pressing of two buttons as soon as the test is finished, so you can see that it is a useful test and provides textural values without need for calculations (and actually makes people think you’ve done a lot of work). o. Time. ‘Decompression’")
31
TPA (TEXTURE PROFILE ANALYSIS)
Movement of the PROBE Force Here is a diagram of the procedure in more detail. From this you can see that on the first compression (or bite) the hardness is determined as the height of the peak force. For samples which are quite brittle the force is seen to have a significant peak in the curve on the first bite which is not present in, for instance, the testing of gels. On the upstroke of the compression probe the force is released and an adhesive value may be obtained depending on the degree of adhesion (or stickiness) of the sample to the probe, for instance in some gels. The distance over which this adhesion takes place is an indication of the stringiness of the product (for instance chewing gum would possess a greater degree of stringiness than would a sample of cream cheese. The springiness (or elasticity) is obtained on the second bite within the duration of the downstroke and gives an indication of the elastic recovery of the sample. Several other textural parameters can also be obtained such as gumminess, chewiness and cohesivess which are calculated from data using the following inbuilt formulae. All of these values are obtained in less than a second by the pressing of two buttons as soon as the test is finished, so you can see that it is a useful test and provides textural values without need for calculations (and actually makes people think you’ve done a lot of work). o Time DOWN
 the hardness is determined as the height of the peak force. For samples which are quite brittle the force is seen to have a significant peak in the curve on the first bite which is not present in, for instance, the testing of gels. On the upstroke of the compression probe the force is released and an adhesive value may be obtained depending on the degree of adhesion (or stickiness) of the sample to the probe, for instance in some gels. The distance over which this adhesion takes place is an indication of the stringiness of the product (for instance chewing gum would possess a greater degree of stringiness than would a sample of cream cheese. The springiness (or elasticity) is obtained on the second bite within the duration of the downstroke and gives an indication of the elastic recovery of the sample. Several other textural parameters can also be obtained such as gumminess, chewiness and cohesivess which are calculated from data using the following inbuilt formulae. All of these values are obtained in less than a second by the pressing of two buttons as soon as the test is finished, so you can see that it is a useful test and provides textural values without need for calculations (and actually makes people think you’ve done a lot of work). o. Time. DOWN.")
32
TPA (TEXTURE PROFILE ANALYSIS)
Movement of the PROBE UP Force Here is a diagram of the procedure in more detail. From this you can see that on the first compression (or bite) the hardness is determined as the height of the peak force. For samples which are quite brittle the force is seen to have a significant peak in the curve on the first bite which is not present in, for instance, the testing of gels. On the upstroke of the compression probe the force is released and an adhesive value may be obtained depending on the degree of adhesion (or stickiness) of the sample to the probe, for instance in some gels. The distance over which this adhesion takes place is an indication of the stringiness of the product (for instance chewing gum would possess a greater degree of stringiness than would a sample of cream cheese. The springiness (or elasticity) is obtained on the second bite within the duration of the downstroke and gives an indication of the elastic recovery of the sample. Several other textural parameters can also be obtained such as gumminess, chewiness and cohesivess which are calculated from data using the following inbuilt formulae. All of these values are obtained in less than a second by the pressing of two buttons as soon as the test is finished, so you can see that it is a useful test and provides textural values without need for calculations (and actually makes people think you’ve done a lot of work). o Time
 the hardness is determined as the height of the peak force. For samples which are quite brittle the force is seen to have a significant peak in the curve on the first bite which is not present in, for instance, the testing of gels. On the upstroke of the compression probe the force is released and an adhesive value may be obtained depending on the degree of adhesion (or stickiness) of the sample to the probe, for instance in some gels. The distance over which this adhesion takes place is an indication of the stringiness of the product (for instance chewing gum would possess a greater degree of stringiness than would a sample of cream cheese. The springiness (or elasticity) is obtained on the second bite within the duration of the downstroke and gives an indication of the elastic recovery of the sample. Several other textural parameters can also be obtained such as gumminess, chewiness and cohesivess which are calculated from data using the following inbuilt formulae. All of these values are obtained in less than a second by the pressing of two buttons as soon as the test is finished, so you can see that it is a useful test and provides textural values without need for calculations (and actually makes people think you’ve done a lot of work). o. Time.")
33
TPA (TEXTURE PROFILE ANALYSIS)
Analysis of the data Fracturability Force Here is a diagram of the procedure in more detail. From this you can see that on the first compression (or bite) the hardness is determined as the height of the peak force. For samples which are quite brittle the force is seen to have a significant peak in the curve on the first bite which is not present in, for instance, the testing of gels. On the upstroke of the compression probe the force is released and an adhesive value may be obtained depending on the degree of adhesion (or stickiness) of the sample to the probe, for instance in some gels. The distance over which this adhesion takes place is an indication of the stringiness of the product (for instance chewing gum would possess a greater degree of stringiness than would a sample of cream cheese. The springiness (or elasticity) is obtained on the second bite within the duration of the downstroke and gives an indication of the elastic recovery of the sample. Several other textural parameters can also be obtained such as gumminess, chewiness and cohesivess which are calculated from data using the following inbuilt formulae. All of these values are obtained in less than a second by the pressing of two buttons as soon as the test is finished, so you can see that it is a useful test and provides textural values without need for calculations (and actually makes people think you’ve done a lot of work). o Time
 the hardness is determined as the height of the peak force. For samples which are quite brittle the force is seen to have a significant peak in the curve on the first bite which is not present in, for instance, the testing of gels. On the upstroke of the compression probe the force is released and an adhesive value may be obtained depending on the degree of adhesion (or stickiness) of the sample to the probe, for instance in some gels. The distance over which this adhesion takes place is an indication of the stringiness of the product (for instance chewing gum would possess a greater degree of stringiness than would a sample of cream cheese. The springiness (or elasticity) is obtained on the second bite within the duration of the downstroke and gives an indication of the elastic recovery of the sample. Several other textural parameters can also be obtained such as gumminess, chewiness and cohesivess which are calculated from data using the following inbuilt formulae. All of these values are obtained in less than a second by the pressing of two buttons as soon as the test is finished, so you can see that it is a useful test and provides textural values without need for calculations (and actually makes people think you’ve done a lot of work). o. Time.")
34
TPA (TEXTURE PROFILE ANALYSIS)
Analysis of the data Definition seberapa kuat suatu produk menahan gaya tekan. Nilai ditentukan dari nilai F puncak yang pertama NB - Not always present Fracturability Force Here is a diagram of the procedure in more detail. From this you can see that on the first compression (or bite) the hardness is determined as the height of the peak force. For samples which are quite brittle the force is seen to have a significant peak in the curve on the first bite which is not present in, for instance, the testing of gels. On the upstroke of the compression probe the force is released and an adhesive value may be obtained depending on the degree of adhesion (or stickiness) of the sample to the probe, for instance in some gels. The distance over which this adhesion takes place is an indication of the stringiness of the product (for instance chewing gum would possess a greater degree of stringiness than would a sample of cream cheese. The springiness (or elasticity) is obtained on the second bite within the duration of the downstroke and gives an indication of the elastic recovery of the sample. Several other textural parameters can also be obtained such as gumminess, chewiness and cohesivess which are calculated from data using the following inbuilt formulae. All of these values are obtained in less than a second by the pressing of two buttons as soon as the test is finished, so you can see that it is a useful test and provides textural values without need for calculations (and actually makes people think you’ve done a lot of work). o Time
 the hardness is determined as the height of the peak force. For samples which are quite brittle the force is seen to have a significant peak in the curve on the first bite which is not present in, for instance, the testing of gels. On the upstroke of the compression probe the force is released and an adhesive value may be obtained depending on the degree of adhesion (or stickiness) of the sample to the probe, for instance in some gels. The distance over which this adhesion takes place is an indication of the stringiness of the product (for instance chewing gum would possess a greater degree of stringiness than would a sample of cream cheese. The springiness (or elasticity) is obtained on the second bite within the duration of the downstroke and gives an indication of the elastic recovery of the sample. Several other textural parameters can also be obtained such as gumminess, chewiness and cohesivess which are calculated from data using the following inbuilt formulae. All of these values are obtained in less than a second by the pressing of two buttons as soon as the test is finished, so you can see that it is a useful test and provides textural values without need for calculations (and actually makes people think you’ve done a lot of work). o. Time.")
35
TPA (TEXTURE PROFILE ANALYSIS)
Analysis of the data Hardness 1 Hardness 2 Force Here is a diagram of the procedure in more detail. From this you can see that on the first compression (or bite) the hardness is determined as the height of the peak force. For samples which are quite brittle the force is seen to have a significant peak in the curve on the first bite which is not present in, for instance, the testing of gels. On the upstroke of the compression probe the force is released and an adhesive value may be obtained depending on the degree of adhesion (or stickiness) of the sample to the probe, for instance in some gels. The distance over which this adhesion takes place is an indication of the stringiness of the product (for instance chewing gum would possess a greater degree of stringiness than would a sample of cream cheese. The springiness (or elasticity) is obtained on the second bite within the duration of the downstroke and gives an indication of the elastic recovery of the sample. Several other textural parameters can also be obtained such as gumminess, chewiness and cohesivess which are calculated from data using the following inbuilt formulae. All of these values are obtained in less than a second by the pressing of two buttons as soon as the test is finished, so you can see that it is a useful test and provides textural values without need for calculations (and actually makes people think you’ve done a lot of work). o Time
 the hardness is determined as the height of the peak force. For samples which are quite brittle the force is seen to have a significant peak in the curve on the first bite which is not present in, for instance, the testing of gels. On the upstroke of the compression probe the force is released and an adhesive value may be obtained depending on the degree of adhesion (or stickiness) of the sample to the probe, for instance in some gels. The distance over which this adhesion takes place is an indication of the stringiness of the product (for instance chewing gum would possess a greater degree of stringiness than would a sample of cream cheese. The springiness (or elasticity) is obtained on the second bite within the duration of the downstroke and gives an indication of the elastic recovery of the sample. Several other textural parameters can also be obtained such as gumminess, chewiness and cohesivess which are calculated from data using the following inbuilt formulae. All of these values are obtained in less than a second by the pressing of two buttons as soon as the test is finished, so you can see that it is a useful test and provides textural values without need for calculations (and actually makes people think you’ve done a lot of work). o. Time.")
36
TPA (TEXTURE PROFILE ANALYSIS)
Analysis of the data Hardness Hardness 2 Definition daya tahan untuk pecah/patah akibat gaya tekan yang diberikan (hanya ada 1 peak). Dikenal juga sbg “firmness”. Force Here is a diagram of the procedure in more detail. From this you can see that on the first compression (or bite) the hardness is determined as the height of the peak force. For samples which are quite brittle the force is seen to have a significant peak in the curve on the first bite which is not present in, for instance, the testing of gels. On the upstroke of the compression probe the force is released and an adhesive value may be obtained depending on the degree of adhesion (or stickiness) of the sample to the probe, for instance in some gels. The distance over which this adhesion takes place is an indication of the stringiness of the product (for instance chewing gum would possess a greater degree of stringiness than would a sample of cream cheese. The springiness (or elasticity) is obtained on the second bite within the duration of the downstroke and gives an indication of the elastic recovery of the sample. Several other textural parameters can also be obtained such as gumminess, chewiness and cohesivess which are calculated from data using the following inbuilt formulae. All of these values are obtained in less than a second by the pressing of two buttons as soon as the test is finished, so you can see that it is a useful test and provides textural values without need for calculations (and actually makes people think you’ve done a lot of work). o Time
. Dikenal juga sbg firmness . Force. Here is a diagram of the procedure in more detail. From this you can see that on the first compression (or bite) the hardness is determined as the height of the peak force. For samples which are quite brittle the force is seen to have a significant peak in the curve on the first bite which is not present in, for instance, the testing of gels. On the upstroke of the compression probe the force is released and an adhesive value may be obtained depending on the degree of adhesion (or stickiness) of the sample to the probe, for instance in some gels. The distance over which this adhesion takes place is an indication of the stringiness of the product (for instance chewing gum would possess a greater degree of stringiness than would a sample of cream cheese. The springiness (or elasticity) is obtained on the second bite within the duration of the downstroke and gives an indication of the elastic recovery of the sample. Several other textural parameters can also be obtained such as gumminess, chewiness and cohesivess which are calculated from data using the following inbuilt formulae. All of these values are obtained in less than a second by the pressing of two buttons as soon as the test is finished, so you can see that it is a useful test and provides textural values without need for calculations (and actually makes people think you’ve done a lot of work). o. Time.")
37
TPA (TEXTURE PROFILE ANALYSIS)
Analysis of the data Area 1 Area 2 Force Here is a diagram of the procedure in more detail. From this you can see that on the first compression (or bite) the hardness is determined as the height of the peak force. For samples which are quite brittle the force is seen to have a significant peak in the curve on the first bite which is not present in, for instance, the testing of gels. On the upstroke of the compression probe the force is released and an adhesive value may be obtained depending on the degree of adhesion (or stickiness) of the sample to the probe, for instance in some gels. The distance over which this adhesion takes place is an indication of the stringiness of the product (for instance chewing gum would possess a greater degree of stringiness than would a sample of cream cheese. The springiness (or elasticity) is obtained on the second bite within the duration of the downstroke and gives an indication of the elastic recovery of the sample. Several other textural parameters can also be obtained such as gumminess, chewiness and cohesivess which are calculated from data using the following inbuilt formulae. All of these values are obtained in less than a second by the pressing of two buttons as soon as the test is finished, so you can see that it is a useful test and provides textural values without need for calculations (and actually makes people think you’ve done a lot of work). A B o Time
 the hardness is determined as the height of the peak force. For samples which are quite brittle the force is seen to have a significant peak in the curve on the first bite which is not present in, for instance, the testing of gels. On the upstroke of the compression probe the force is released and an adhesive value may be obtained depending on the degree of adhesion (or stickiness) of the sample to the probe, for instance in some gels. The distance over which this adhesion takes place is an indication of the stringiness of the product (for instance chewing gum would possess a greater degree of stringiness than would a sample of cream cheese. The springiness (or elasticity) is obtained on the second bite within the duration of the downstroke and gives an indication of the elastic recovery of the sample. Several other textural parameters can also be obtained such as gumminess, chewiness and cohesivess which are calculated from data using the following inbuilt formulae. All of these values are obtained in less than a second by the pressing of two buttons as soon as the test is finished, so you can see that it is a useful test and provides textural values without need for calculations (and actually makes people think you’ve done a lot of work). A. B. o. Time.")
38
TPA (TEXTURE PROFILE ANALYSIS)
Analysis of the data Cohesiveness Dihitung dari luasan di bawah kurva pada tekanan kedua (A2) dibagi dengan luasan di bawah kurva pada tekanan pertama (A1) Force Here is a diagram of the procedure in more detail. From this you can see that on the first compression (or bite) the hardness is determined as the height of the peak force. For samples which are quite brittle the force is seen to have a significant peak in the curve on the first bite which is not present in, for instance, the testing of gels. On the upstroke of the compression probe the force is released and an adhesive value may be obtained depending on the degree of adhesion (or stickiness) of the sample to the probe, for instance in some gels. The distance over which this adhesion takes place is an indication of the stringiness of the product (for instance chewing gum would possess a greater degree of stringiness than would a sample of cream cheese. The springiness (or elasticity) is obtained on the second bite within the duration of the downstroke and gives an indication of the elastic recovery of the sample. Several other textural parameters can also be obtained such as gumminess, chewiness and cohesivess which are calculated from data using the following inbuilt formulae. All of these values are obtained in less than a second by the pressing of two buttons as soon as the test is finished, so you can see that it is a useful test and provides textural values without need for calculations (and actually makes people think you’ve done a lot of work). A B o Time
 dibagi dengan luasan di bawah kurva pada tekanan pertama (A1) Force. Here is a diagram of the procedure in more detail. From this you can see that on the first compression (or bite) the hardness is determined as the height of the peak force. For samples which are quite brittle the force is seen to have a significant peak in the curve on the first bite which is not present in, for instance, the testing of gels. On the upstroke of the compression probe the force is released and an adhesive value may be obtained depending on the degree of adhesion (or stickiness) of the sample to the probe, for instance in some gels. The distance over which this adhesion takes place is an indication of the stringiness of the product (for instance chewing gum would possess a greater degree of stringiness than would a sample of cream cheese. The springiness (or elasticity) is obtained on the second bite within the duration of the downstroke and gives an indication of the elastic recovery of the sample. Several other textural parameters can also be obtained such as gumminess, chewiness and cohesivess which are calculated from data using the following inbuilt formulae. All of these values are obtained in less than a second by the pressing of two buttons as soon as the test is finished, so you can see that it is a useful test and provides textural values without need for calculations (and actually makes people think you’ve done a lot of work). A. B. o. Time.")
39
TPA (TEXTURE PROFILE ANALYSIS)
Analysis of the data Force Here is a diagram of the procedure in more detail. From this you can see that on the first compression (or bite) the hardness is determined as the height of the peak force. For samples which are quite brittle the force is seen to have a significant peak in the curve on the first bite which is not present in, for instance, the testing of gels. On the upstroke of the compression probe the force is released and an adhesive value may be obtained depending on the degree of adhesion (or stickiness) of the sample to the probe, for instance in some gels. The distance over which this adhesion takes place is an indication of the stringiness of the product (for instance chewing gum would possess a greater degree of stringiness than would a sample of cream cheese. The springiness (or elasticity) is obtained on the second bite within the duration of the downstroke and gives an indication of the elastic recovery of the sample. Several other textural parameters can also be obtained such as gumminess, chewiness and cohesivess which are calculated from data using the following inbuilt formulae. All of these values are obtained in less than a second by the pressing of two buttons as soon as the test is finished, so you can see that it is a useful test and provides textural values without need for calculations (and actually makes people think you’ve done a lot of work). A B o Time
 the hardness is determined as the height of the peak force. For samples which are quite brittle the force is seen to have a significant peak in the curve on the first bite which is not present in, for instance, the testing of gels. On the upstroke of the compression probe the force is released and an adhesive value may be obtained depending on the degree of adhesion (or stickiness) of the sample to the probe, for instance in some gels. The distance over which this adhesion takes place is an indication of the stringiness of the product (for instance chewing gum would possess a greater degree of stringiness than would a sample of cream cheese. The springiness (or elasticity) is obtained on the second bite within the duration of the downstroke and gives an indication of the elastic recovery of the sample. Several other textural parameters can also be obtained such as gumminess, chewiness and cohesivess which are calculated from data using the following inbuilt formulae. All of these values are obtained in less than a second by the pressing of two buttons as soon as the test is finished, so you can see that it is a useful test and provides textural values without need for calculations (and actually makes people think you’ve done a lot of work). A. B. o. Time.")
40
TPA (TEXTURE PROFILE ANALYSIS)
Analysis of the data Force Here is a diagram of the procedure in more detail. From this you can see that on the first compression (or bite) the hardness is determined as the height of the peak force. For samples which are quite brittle the force is seen to have a significant peak in the curve on the first bite which is not present in, for instance, the testing of gels. On the upstroke of the compression probe the force is released and an adhesive value may be obtained depending on the degree of adhesion (or stickiness) of the sample to the probe, for instance in some gels. The distance over which this adhesion takes place is an indication of the stringiness of the product (for instance chewing gum would possess a greater degree of stringiness than would a sample of cream cheese. The springiness (or elasticity) is obtained on the second bite within the duration of the downstroke and gives an indication of the elastic recovery of the sample. Several other textural parameters can also be obtained such as gumminess, chewiness and cohesivess which are calculated from data using the following inbuilt formulae. All of these values are obtained in less than a second by the pressing of two buttons as soon as the test is finished, so you can see that it is a useful test and provides textural values without need for calculations (and actually makes people think you’ve done a lot of work). A B o Time
 the hardness is determined as the height of the peak force. For samples which are quite brittle the force is seen to have a significant peak in the curve on the first bite which is not present in, for instance, the testing of gels. On the upstroke of the compression probe the force is released and an adhesive value may be obtained depending on the degree of adhesion (or stickiness) of the sample to the probe, for instance in some gels. The distance over which this adhesion takes place is an indication of the stringiness of the product (for instance chewing gum would possess a greater degree of stringiness than would a sample of cream cheese. The springiness (or elasticity) is obtained on the second bite within the duration of the downstroke and gives an indication of the elastic recovery of the sample. Several other textural parameters can also be obtained such as gumminess, chewiness and cohesivess which are calculated from data using the following inbuilt formulae. All of these values are obtained in less than a second by the pressing of two buttons as soon as the test is finished, so you can see that it is a useful test and provides textural values without need for calculations (and actually makes people think you’ve done a lot of work). A. B. o. Time.")
41
TPA (TEXTURE PROFILE ANALYSIS)
Analysis of the data Springiness Force Here is a diagram of the procedure in more detail. From this you can see that on the first compression (or bite) the hardness is determined as the height of the peak force. For samples which are quite brittle the force is seen to have a significant peak in the curve on the first bite which is not present in, for instance, the testing of gels. On the upstroke of the compression probe the force is released and an adhesive value may be obtained depending on the degree of adhesion (or stickiness) of the sample to the probe, for instance in some gels. The distance over which this adhesion takes place is an indication of the stringiness of the product (for instance chewing gum would possess a greater degree of stringiness than would a sample of cream cheese. The springiness (or elasticity) is obtained on the second bite within the duration of the downstroke and gives an indication of the elastic recovery of the sample. Several other textural parameters can also be obtained such as gumminess, chewiness and cohesivess which are calculated from data using the following inbuilt formulae. All of these values are obtained in less than a second by the pressing of two buttons as soon as the test is finished, so you can see that it is a useful test and provides textural values without need for calculations (and actually makes people think you’ve done a lot of work). o Time
 the hardness is determined as the height of the peak force. For samples which are quite brittle the force is seen to have a significant peak in the curve on the first bite which is not present in, for instance, the testing of gels. On the upstroke of the compression probe the force is released and an adhesive value may be obtained depending on the degree of adhesion (or stickiness) of the sample to the probe, for instance in some gels. The distance over which this adhesion takes place is an indication of the stringiness of the product (for instance chewing gum would possess a greater degree of stringiness than would a sample of cream cheese. The springiness (or elasticity) is obtained on the second bite within the duration of the downstroke and gives an indication of the elastic recovery of the sample. Several other textural parameters can also be obtained such as gumminess, chewiness and cohesivess which are calculated from data using the following inbuilt formulae. All of these values are obtained in less than a second by the pressing of two buttons as soon as the test is finished, so you can see that it is a useful test and provides textural values without need for calculations (and actually makes people think you’ve done a lot of work). o. Time.")
42
TPA (TEXTURE PROFILE ANALYSIS)
Analysis of the data Definition The height that the food recovers during the time that elapses between the end of the first cycle and the start of the second cycle. Springiness Force Here is a diagram of the procedure in more detail. From this you can see that on the first compression (or bite) the hardness is determined as the height of the peak force. For samples which are quite brittle the force is seen to have a significant peak in the curve on the first bite which is not present in, for instance, the testing of gels. On the upstroke of the compression probe the force is released and an adhesive value may be obtained depending on the degree of adhesion (or stickiness) of the sample to the probe, for instance in some gels. The distance over which this adhesion takes place is an indication of the stringiness of the product (for instance chewing gum would possess a greater degree of stringiness than would a sample of cream cheese. The springiness (or elasticity) is obtained on the second bite within the duration of the downstroke and gives an indication of the elastic recovery of the sample. Several other textural parameters can also be obtained such as gumminess, chewiness and cohesivess which are calculated from data using the following inbuilt formulae. All of these values are obtained in less than a second by the pressing of two buttons as soon as the test is finished, so you can see that it is a useful test and provides textural values without need for calculations (and actually makes people think you’ve done a lot of work). o Time
 the hardness is determined as the height of the peak force. For samples which are quite brittle the force is seen to have a significant peak in the curve on the first bite which is not present in, for instance, the testing of gels. On the upstroke of the compression probe the force is released and an adhesive value may be obtained depending on the degree of adhesion (or stickiness) of the sample to the probe, for instance in some gels. The distance over which this adhesion takes place is an indication of the stringiness of the product (for instance chewing gum would possess a greater degree of stringiness than would a sample of cream cheese. The springiness (or elasticity) is obtained on the second bite within the duration of the downstroke and gives an indication of the elastic recovery of the sample. Several other textural parameters can also be obtained such as gumminess, chewiness and cohesivess which are calculated from data using the following inbuilt formulae. All of these values are obtained in less than a second by the pressing of two buttons as soon as the test is finished, so you can see that it is a useful test and provides textural values without need for calculations (and actually makes people think you’ve done a lot of work). o. Time.")
43
TPA (TEXTURE PROFILE ANALYSIS)
Analysis of the data Springiness Force Here is a diagram of the procedure in more detail. From this you can see that on the first compression (or bite) the hardness is determined as the height of the peak force. For samples which are quite brittle the force is seen to have a significant peak in the curve on the first bite which is not present in, for instance, the testing of gels. On the upstroke of the compression probe the force is released and an adhesive value may be obtained depending on the degree of adhesion (or stickiness) of the sample to the probe, for instance in some gels. The distance over which this adhesion takes place is an indication of the stringiness of the product (for instance chewing gum would possess a greater degree of stringiness than would a sample of cream cheese. The springiness (or elasticity) is obtained on the second bite within the duration of the downstroke and gives an indication of the elastic recovery of the sample. Several other textural parameters can also be obtained such as gumminess, chewiness and cohesivess which are calculated from data using the following inbuilt formulae. All of these values are obtained in less than a second by the pressing of two buttons as soon as the test is finished, so you can see that it is a useful test and provides textural values without need for calculations (and actually makes people think you’ve done a lot of work). o Time
 the hardness is determined as the height of the peak force. For samples which are quite brittle the force is seen to have a significant peak in the curve on the first bite which is not present in, for instance, the testing of gels. On the upstroke of the compression probe the force is released and an adhesive value may be obtained depending on the degree of adhesion (or stickiness) of the sample to the probe, for instance in some gels. The distance over which this adhesion takes place is an indication of the stringiness of the product (for instance chewing gum would possess a greater degree of stringiness than would a sample of cream cheese. The springiness (or elasticity) is obtained on the second bite within the duration of the downstroke and gives an indication of the elastic recovery of the sample. Several other textural parameters can also be obtained such as gumminess, chewiness and cohesivess which are calculated from data using the following inbuilt formulae. All of these values are obtained in less than a second by the pressing of two buttons as soon as the test is finished, so you can see that it is a useful test and provides textural values without need for calculations (and actually makes people think you’ve done a lot of work). o. Time.")
44
TPA (TEXTURE PROFILE ANALYSIS)
Analysis of the data Work of Adhesion Force Here is a diagram of the procedure in more detail. From this you can see that on the first compression (or bite) the hardness is determined as the height of the peak force. For samples which are quite brittle the force is seen to have a significant peak in the curve on the first bite which is not present in, for instance, the testing of gels. On the upstroke of the compression probe the force is released and an adhesive value may be obtained depending on the degree of adhesion (or stickiness) of the sample to the probe, for instance in some gels. The distance over which this adhesion takes place is an indication of the stringiness of the product (for instance chewing gum would possess a greater degree of stringiness than would a sample of cream cheese. The springiness (or elasticity) is obtained on the second bite within the duration of the downstroke and gives an indication of the elastic recovery of the sample. Several other textural parameters can also be obtained such as gumminess, chewiness and cohesivess which are calculated from data using the following inbuilt formulae. All of these values are obtained in less than a second by the pressing of two buttons as soon as the test is finished, so you can see that it is a useful test and provides textural values without need for calculations (and actually makes people think you’ve done a lot of work). o Time Adhesivness
 the hardness is determined as the height of the peak force. For samples which are quite brittle the force is seen to have a significant peak in the curve on the first bite which is not present in, for instance, the testing of gels. On the upstroke of the compression probe the force is released and an adhesive value may be obtained depending on the degree of adhesion (or stickiness) of the sample to the probe, for instance in some gels. The distance over which this adhesion takes place is an indication of the stringiness of the product (for instance chewing gum would possess a greater degree of stringiness than would a sample of cream cheese. The springiness (or elasticity) is obtained on the second bite within the duration of the downstroke and gives an indication of the elastic recovery of the sample. Several other textural parameters can also be obtained such as gumminess, chewiness and cohesivess which are calculated from data using the following inbuilt formulae. All of these values are obtained in less than a second by the pressing of two buttons as soon as the test is finished, so you can see that it is a useful test and provides textural values without need for calculations (and actually makes people think you’ve done a lot of work). o. Time. Adhesivness.")
45
TPA (TEXTURE PROFILE ANALYSIS)
Analysis of the data Work of Adhesion Definition The negative area for the first compression cycle - representing the work needed to overcome the attractive forces between the surfaces of the probe and the food. Force Here is a diagram of the procedure in more detail. From this you can see that on the first compression (or bite) the hardness is determined as the height of the peak force. For samples which are quite brittle the force is seen to have a significant peak in the curve on the first bite which is not present in, for instance, the testing of gels. On the upstroke of the compression probe the force is released and an adhesive value may be obtained depending on the degree of adhesion (or stickiness) of the sample to the probe, for instance in some gels. The distance over which this adhesion takes place is an indication of the stringiness of the product (for instance chewing gum would possess a greater degree of stringiness than would a sample of cream cheese. The springiness (or elasticity) is obtained on the second bite within the duration of the downstroke and gives an indication of the elastic recovery of the sample. Several other textural parameters can also be obtained such as gumminess, chewiness and cohesivess which are calculated from data using the following inbuilt formulae. All of these values are obtained in less than a second by the pressing of two buttons as soon as the test is finished, so you can see that it is a useful test and provides textural values without need for calculations (and actually makes people think you’ve done a lot of work). o Time
 the hardness is determined as the height of the peak force. For samples which are quite brittle the force is seen to have a significant peak in the curve on the first bite which is not present in, for instance, the testing of gels. On the upstroke of the compression probe the force is released and an adhesive value may be obtained depending on the degree of adhesion (or stickiness) of the sample to the probe, for instance in some gels. The distance over which this adhesion takes place is an indication of the stringiness of the product (for instance chewing gum would possess a greater degree of stringiness than would a sample of cream cheese. The springiness (or elasticity) is obtained on the second bite within the duration of the downstroke and gives an indication of the elastic recovery of the sample. Several other textural parameters can also be obtained such as gumminess, chewiness and cohesivess which are calculated from data using the following inbuilt formulae. All of these values are obtained in less than a second by the pressing of two buttons as soon as the test is finished, so you can see that it is a useful test and provides textural values without need for calculations (and actually makes people think you’ve done a lot of work). o. Time.")
46
TPA (TEXTURE PROFILE ANALYSIS)
Analysis of the data Definition The maximum negative force of the first compression cycle Force Here is a diagram of the procedure in more detail. From this you can see that on the first compression (or bite) the hardness is determined as the height of the peak force. For samples which are quite brittle the force is seen to have a significant peak in the curve on the first bite which is not present in, for instance, the testing of gels. On the upstroke of the compression probe the force is released and an adhesive value may be obtained depending on the degree of adhesion (or stickiness) of the sample to the probe, for instance in some gels. The distance over which this adhesion takes place is an indication of the stringiness of the product (for instance chewing gum would possess a greater degree of stringiness than would a sample of cream cheese. The springiness (or elasticity) is obtained on the second bite within the duration of the downstroke and gives an indication of the elastic recovery of the sample. Several other textural parameters can also be obtained such as gumminess, chewiness and cohesivess which are calculated from data using the following inbuilt formulae. All of these values are obtained in less than a second by the pressing of two buttons as soon as the test is finished, so you can see that it is a useful test and provides textural values without need for calculations (and actually makes people think you’ve done a lot of work). o Time Adhesivness
 the hardness is determined as the height of the peak force. For samples which are quite brittle the force is seen to have a significant peak in the curve on the first bite which is not present in, for instance, the testing of gels. On the upstroke of the compression probe the force is released and an adhesive value may be obtained depending on the degree of adhesion (or stickiness) of the sample to the probe, for instance in some gels. The distance over which this adhesion takes place is an indication of the stringiness of the product (for instance chewing gum would possess a greater degree of stringiness than would a sample of cream cheese. The springiness (or elasticity) is obtained on the second bite within the duration of the downstroke and gives an indication of the elastic recovery of the sample. Several other textural parameters can also be obtained such as gumminess, chewiness and cohesivess which are calculated from data using the following inbuilt formulae. All of these values are obtained in less than a second by the pressing of two buttons as soon as the test is finished, so you can see that it is a useful test and provides textural values without need for calculations (and actually makes people think you’ve done a lot of work). o. Time. Adhesivness.")
47
Texture Profile Analysis (TPA)
")
48
CONTOH KASUS Kentang diiris bentuk kubus dgn berukuran 1 cm3 dan kemudian direbus secara terpisah: A – 0 menit (mentah) B – 1 menit C – 2 menit D – 3 menit Segera setelah diberi perlakuan, kentang tersebut diukur dgn TA instruments dengan spindle “heavy duty platform dgn ukuran 35 mm silinder”

49
CONTOH KASUS Jika diperoleh profil tekstur sbb, parameter apakah yang dapat digunakan sebagai perbandingan? Dapatkah diketahui nilai brittleness??

50
CONTOH KASUS Apakah kesimpulan yang dapat diperoleh dari data diatas??

54
Dough Properties

55
Pengukuran Sifat Gelatinisasi Pati
Profil viskositas dan kemampuan membentuk gel dari pati selama proses pemasakan Instrumen: Brabender Viscograph Rapid Visco Analyzer (RVA) Satuan viskositas: cP, Brabender Unit (BU), Rapid Visco Unit (RVU)
 Satuan viskositas: cP, Brabender Unit (BU), Rapid Visco Unit (RVU)")
56
Rapid Visco Analyzer

57
Rapid Visco Analyzer (RVA)
")
58
Brabender Viscograph Measures the viscosity (deflection is measured as torque) of starch containing products as a function of temperature and time (ICC-Standard Nr. 126) The sample is heated up within a rotating bowl and cooled down again. Pins in the bowl provide for good mixing and prevent sedimentation.
 of starch containing products as a function of temperature and time (ICC-Standard Nr. 126) The sample is heated up within a rotating bowl and cooled down again. Pins in the bowl provide for good mixing and prevent sedimentation.")
59
Brabender Viscograph Bagian-bagian dari alat: (1) Wadah mangkuk (2) Pengaduk berputar yang terbuat dari baja tahan karat. (3) Pegas pengukur yang sangat sensitif. (4) Pengatur kecepatan. (5) Rekorder (6) Sumber panas (7) Pengatur panas (11) Timer
 Wadah mangkuk (2) Pengaduk berputar yang terbuat dari baja tahan karat. (3) Pegas pengukur yang sangat sensitif. (4) Pengatur kecepatan. (5) Rekorder (6) Sumber panas (7) Pengatur panas (11) Timer")
61
Tahapan Tahap pemanasan (heating), yaitu suhu viscograph akan meningkat dari 30oC hingga 95oC dengan kecepatan 1.5oC/menit. Pada tahap ini, suspensi pati akan mengalami proses gelatinisasi dan akan dihasilkan pasta pati. Tahap holding pada suhu pemasakan, yaitu suhu viscograph dipertahankan pada suhu 95oC selama menit untuk mengetahui kestabilan pasta pati pada suhu pemasakan tersebut. Tahap pendinginan (cooling), yaitu suhu sampel dalam viscograph akan diturunkan secara bertahap dari 95oC ke suhu 50oC dengan kecepatan 1.5oC/menit. Pasta pati akan berangsur-angsur menuju gel yang menyebabkan viskositasnya meningkat. Tahap holding pada suhu pendinginan, yaitu suhu viscograph dipertahankan pada suhu 50oC selama menit untuk mengetahui kestabilan pasta pati oleh proses pengadukan.
, yaitu suhu viscograph akan meningkat dari 30oC hingga 95oC dengan kecepatan 1.5oC/menit. Pada tahap ini, suspensi pati akan mengalami proses gelatinisasi dan akan dihasilkan pasta pati. Tahap holding pada suhu pemasakan, yaitu suhu viscograph dipertahankan pada suhu 95oC selama menit untuk mengetahui kestabilan pasta pati pada suhu pemasakan tersebut. Tahap pendinginan (cooling), yaitu suhu sampel dalam viscograph akan diturunkan secara bertahap dari 95oC ke suhu 50oC dengan kecepatan 1.5oC/menit. Pasta pati akan berangsur-angsur menuju gel yang menyebabkan viskositasnya meningkat. Tahap holding pada suhu pendinginan, yaitu suhu viscograph dipertahankan pada suhu 50oC selama menit untuk mengetahui kestabilan pasta pati oleh proses pengadukan.")
62
Profil viskositas dari suspensi pati yang diukur dengan Brabender Viscograph
Keterangan: (A) awal proses gelatinisasi; (B) viskositas maksimum (granula pati mulai pecah); (C) viskositas pada 95oC, (D) viskositas setelah holding pada 95oC; (E) viskositas pada 50oC (setelah pendinginan), (F) viskositas setelah holding pada 50oC.
 awal proses gelatinisasi; (B) viskositas maksimum (granula pati mulai pecah); (C) viskositas pada 95oC, (D) viskositas setelah holding pada 95oC; (E) viskositas pada 50oC (setelah pendinginan), (F) viskositas setelah holding pada 50oC.")
63
Contoh Diagram viscogram suspensi tepung sorgum, terigu dan campurannya

64
Parameter yang terukur
Waktu gelatinisasi (menit) Waktu pada saat viscograph mulai mencatat awal pembacaan nilai viskositas. Pada viscogram, waktu gelatinisasi ini dapat dibaca pada tahap pemanasan pada saat pensil pencatat mulai menyimpang dari garis 0 BU. Suhu Gelatinisasi (oC) Suhu pada saat viscograph mulai membaca nilai viskositas. Karena viscogram tidak mencatat suhu, maka suhu gelatinisasi ini dihitung dengan cara mengalikan kecepatan peningkatan suhu (1.5oC/menit) dengan waktu gelatinisasi (menit) ditambah dengan suhu awal proses pemasanan (misal 30oC).
 Waktu pada saat viscograph mulai mencatat awal pembacaan nilai viskositas. Pada viscogram, waktu gelatinisasi ini dapat dibaca pada tahap pemanasan pada saat pensil pencatat mulai menyimpang dari garis 0 BU. Suhu Gelatinisasi (oC) Suhu pada saat viscograph mulai membaca nilai viskositas. Karena viscogram tidak mencatat suhu, maka suhu gelatinisasi ini dihitung dengan cara mengalikan kecepatan peningkatan suhu (1.5oC/menit) dengan waktu gelatinisasi (menit) ditambah dengan suhu awal proses pemasanan (misal 30oC).")
65
Parameter yang terukur
Waktu granula pecah (menit) Waktu pada saat viscograph membaca nilai maksimum viskositas pada tahap proses pemanasan. Pada viscogram, waktu gelatinisasi ini dapat dibaca pada saat nilai viskositas pada viscograph mencapai nilai puncaknya. Viskositas maksimum (BU) Nilai viskositas maksimum (titik puncak) dari pasta pati yang terbaca oleh viscograph selama tahap pemanasan.
 Waktu pada saat viscograph membaca nilai maksimum viskositas pada tahap proses pemanasan. Pada viscogram, waktu gelatinisasi ini dapat dibaca pada saat nilai viskositas pada viscograph mencapai nilai puncaknya. Viskositas maksimum (BU) Nilai viskositas maksimum (titik puncak) dari pasta pati yang terbaca oleh viscograph selama tahap pemanasan.")
66
Parameter yang terukur
Suhu granula pecah (oC) Suhu pada saat viscograph pada tahap proses pemanasan mencatat nilai viskositas maksimum. Suhu gelatinisasi ini dihitung dengan cara mengalikan kecepatan peningkatan suhu (1.5oC/menit) dengan waktu granula pecah (menit) ditambah dengan suhu awal proses pemasanan (misal 50oC). Viskositas pada suhu 95 oC (BU) Nilai viskositas dari pasta pada tahap pemanasan setelah mencapai suhu 95oC (titik C).
 Suhu pada saat viscograph pada tahap proses pemanasan mencatat nilai viskositas maksimum. Suhu gelatinisasi ini dihitung dengan cara mengalikan kecepatan peningkatan suhu (1.5oC/menit) dengan waktu granula pecah (menit) ditambah dengan suhu awal proses pemasanan (misal 50oC). Viskositas pada suhu 95 oC (BU) Nilai viskositas dari pasta pada tahap pemanasan setelah mencapai suhu 95oC (titik C).")
67
Parameter yang terukur
Viskositas pada suhu 95 oC setelah holding (BU) Viskositas dari pasta setelah suhu dari viscograph dipertahankan pada 95oC selama waktu tertentu (20-30 menit). Viskositas ini menunjukkan tingkat kestabilan pasta pati selama pemasakan. Viskositas breakdown (BU) Viskositas breakdown menggambarkan tingkat kestabilan pasta pati terhadap proses pemanasan. Viskositas breakdown ini diperoleh sebagai selisih antara viskositas maksimum dengan viskositas pasta pati setelah mencapai pada 95oC pada tahap pemasanan.
 Viskositas dari pasta setelah suhu dari viscograph dipertahankan pada 95oC selama waktu tertentu (20-30 menit). Viskositas ini menunjukkan tingkat kestabilan pasta pati selama pemasakan. Viskositas breakdown (BU) Viskositas breakdown menggambarkan tingkat kestabilan pasta pati terhadap proses pemanasan. Viskositas breakdown ini diperoleh sebagai selisih antara viskositas maksimum dengan viskositas pasta pati setelah mencapai pada 95oC pada tahap pemasanan.")
68
Parameter yang terukur
Viskositas pada suhu 50oC (BU) Nilai viskositas dari pasta setelah akhir tahap pendinginan, dimana pasta telah mencapai suhu 50oC. Viskositas pada suhu 50oC setelah holding (BU) Nilai viskositas dari pasta setelah akhir holding pada suhu 50oC selama menit. Viskositas setback (BU) Viskositas setback menggambarkan tingkat kecenderungan proses retrogradasi pasta pati. Viskositas setback ini diperoleh sebagai selisih antara viskositas pada suhu 50oC dengan dengan viskotas maksimum pada tahap proses pemanasan.
 Nilai viskositas dari pasta setelah akhir tahap pendinginan, dimana pasta telah mencapai suhu 50oC. Viskositas pada suhu 50oC setelah holding (BU) Nilai viskositas dari pasta setelah akhir holding pada suhu 50oC selama menit. Viskositas setback (BU) Viskositas setback menggambarkan tingkat kecenderungan proses retrogradasi pasta pati. Viskositas setback ini diperoleh sebagai selisih antara viskositas pada suhu 50oC dengan dengan viskotas maksimum pada tahap proses pemanasan.")
69
Parameter yang terukur
Kestabilan viskositas pasta terhadap proses pengadukan (BU) Kestabilan viskositas pasta terhadap proses pengadukan diamati pada tahap pendinginan, yaitu dihitung dari selisih antara viskositas pasta pada suhu 50oC setelah holding dengan viskositas pasta pada suhu 50oC sebelum holding.
 Kestabilan viskositas pasta terhadap proses pengadukan diamati pada tahap pendinginan, yaitu dihitung dari selisih antara viskositas pasta pada suhu 50oC setelah holding dengan viskositas pasta pada suhu 50oC sebelum holding.")
70
Brabender-Farinograph
Analisis mutu kekuatan adonan tepung Farinogram merefleksikan perilaku tepung selama dibuat adonan dan fermentasi dalam pembuatan roti: (1) daya absorbsi air untuk membuat adonan dan (2)profil pengadukan
 daya absorbsi air untuk membuat adonan dan (2)profil pengadukan.")
71
Brabender-Farinograph
Diagram farinogram DSA diukur pada kadar air 14% DSA = 2 (x + y) – 50% dimana: x= jumlah air (ml) yang ditambahkan tiap 50 gram tepung dan y = bobot tepung yang ditimbang setara kadar air 14% Daya serap air (DSA) kapasitas penyerapan air maksimum dari tepung untuk menghasilkan adonan dengan konsistensi tertentu. konsistensi yang diinginkan berkorelasi dengan tengah kurva yang terletak di atas garis 500 BU
 – 50% dimana: x= jumlah air (ml) yang ditambahkan tiap 50 gram tepung dan y = bobot tepung yang ditimbang setara kadar air 14% Daya serap air (DSA) kapasitas penyerapan air maksimum dari tepung untuk menghasilkan adonan dengan konsistensi tertentu. konsistensi yang diinginkan berkorelasi dengan tengah kurva yang terletak di atas garis 500 BU.")
72
Brabender-Farinograph
Diagram farinogram Peak time Peak time adalah waktu yang dibutuhkan oleh kurva untuk mencapai konsistensi maksimum, atau disebut juga waktu pengembangan adonan.

73
Brabender-Farinograph
Diagram farinogram Departure time Departure time adalah waktu sejak penambahan air sampai pada saat kurva meninggalkan garis 500 BU. Departure time yang lambat menunjukkan tepung yang mempunyai toleransi yang baik terhadap mixing.

74
Brabender-Farinograph
Diagram farinogram Stability Stabilitas adonan adalah perbedaan waktu pada saat grafik farinogram menyentuh garis 500 BU (arrival time) dengan waktu pada saat grafik meninggalkan garis 500 BU (departure time). Stabilitas dapat digunakan sebagai indikasi yang baik terhadap indeks toleransi adonan.
 dengan waktu pada saat grafik meninggalkan garis 500 BU (departure time). Stabilitas dapat digunakan sebagai indikasi yang baik terhadap indeks toleransi adonan.")
75
Indeks toleransi adonan (weakening of dough).
Brabender-Farinograph Indeks toleransi adonan (weakening of dough). Diagram farinogram Indeks toleransi adonan Indeks toleransi adonan (weakening of dough) menunjukkan besar kecilnya toleransi adonan terhadap gaya-gaya mekanik selama pengadonan: angka dalam BU yang menunjukkan jarak penurunan kurva dari garis 500 BU pada waktu 5 menit setelah kurva mencapai puncak konsistensinya.
. Diagram farinogram. Indeks toleransi adonan. Indeks toleransi adonan (weakening of dough) menunjukkan besar kecilnya toleransi adonan terhadap gaya-gaya mekanik selama pengadonan: angka dalam BU yang menunjukkan jarak penurunan kurva dari garis 500 BU pada waktu 5 menit setelah kurva mencapai puncak konsistensinya.")
76
Brabender-Farinograph
Diagram farinogram Arrival time Arrival time adalah waktu yang dibutuhkan oleh kurva untuk menyentuh garis 500 BU setelah mixer dijalankan dan air ditambahkan. Nilai ini menunjukkan kecepatan air diserap oleh tepung dan nilainya meningkat dengan meningkatnya kadar protein tepung.

77
Brabender-Farinograph
Diagram farinogram Pengembangan adonan Pengembangan adonan adalah waktu mulai dari saat penambahan air sampai pada pengembangan adonan mencapai konsistensi (kekukuhan) maksimum. Nilai ini ditunjukkan oleh peak time. Bila didapat 2 buah kurva, maka yang diambil adalah kurva kedua. Nilai yang diperoleh = mixing time yang diperlukan tepung.
 maksimum. Nilai ini ditunjukkan oleh peak time. Bila didapat 2 buah kurva, maka yang diambil adalah kurva kedua. Nilai yang diperoleh = mixing time yang diperlukan tepung.")
78
Brabender-Extensograph
Measures the stretching properties of wheat flour doughs, in particular the resistance to extension and the extensibility (ICC-Standard Nr. 114/1). Digunakan untuk prediksi kemungkinan-kemungkinan volume produk (misalnya roti) yang terbentuk, dimana alat ini mengukur ekstensibilitas (daya mulur) dan resistensi adonan
. Digunakan untuk prediksi kemungkinan-kemungkinan volume produk (misalnya roti) yang terbentuk, dimana alat ini mengukur ekstensibilitas (daya mulur) dan resistensi adonan.")
79
Brabender-Extensograph
Kemampuan rentang (B) ditunjukkan oleh tinggi maksimum kurva (dalam BU) pada Ekstensogram. Extensibilitas (C) ditunjukkan dengan panjang kurva (cm), dimulai dari awal terentang sampai terpotong. Luasan di bawah kurva (A), adalah luasan di atas garis dasar yang dilingkupi oleh busur kurva Rasio: B/C Diagram Ekstensogram
 ditunjukkan oleh tinggi maksimum kurva (dalam BU) pada Ekstensogram. Extensibilitas (C) ditunjukkan dengan panjang kurva (cm), dimulai dari awal terentang sampai terpotong. Luasan di bawah kurva (A), adalah luasan di atas garis dasar yang dilingkupi oleh busur kurva. Rasio: B/C. Diagram Ekstensogram.")
Presentasi serupa
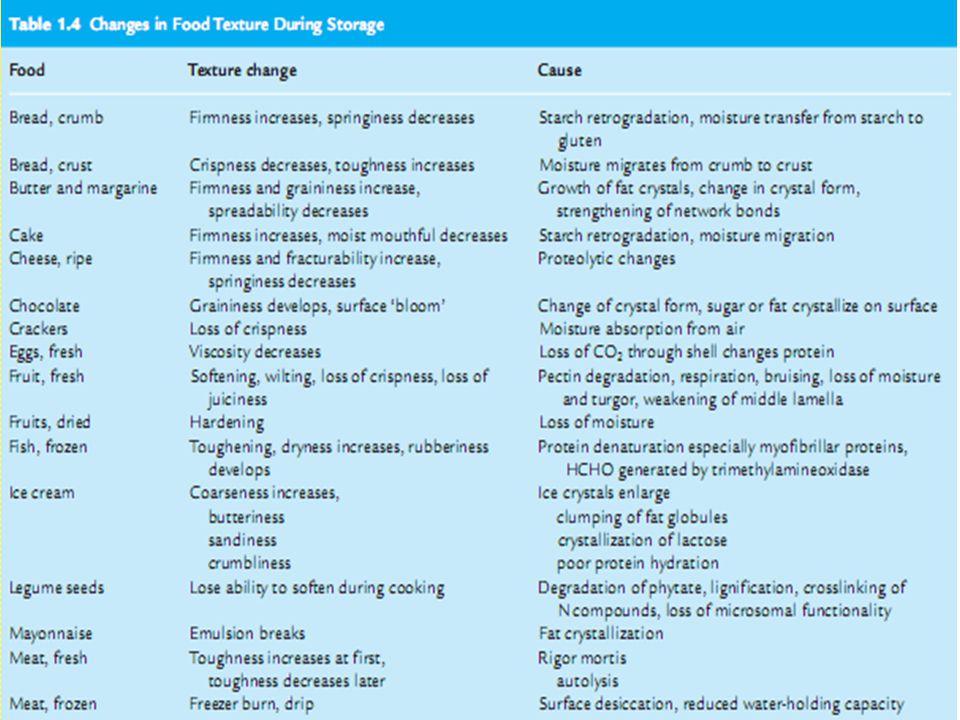
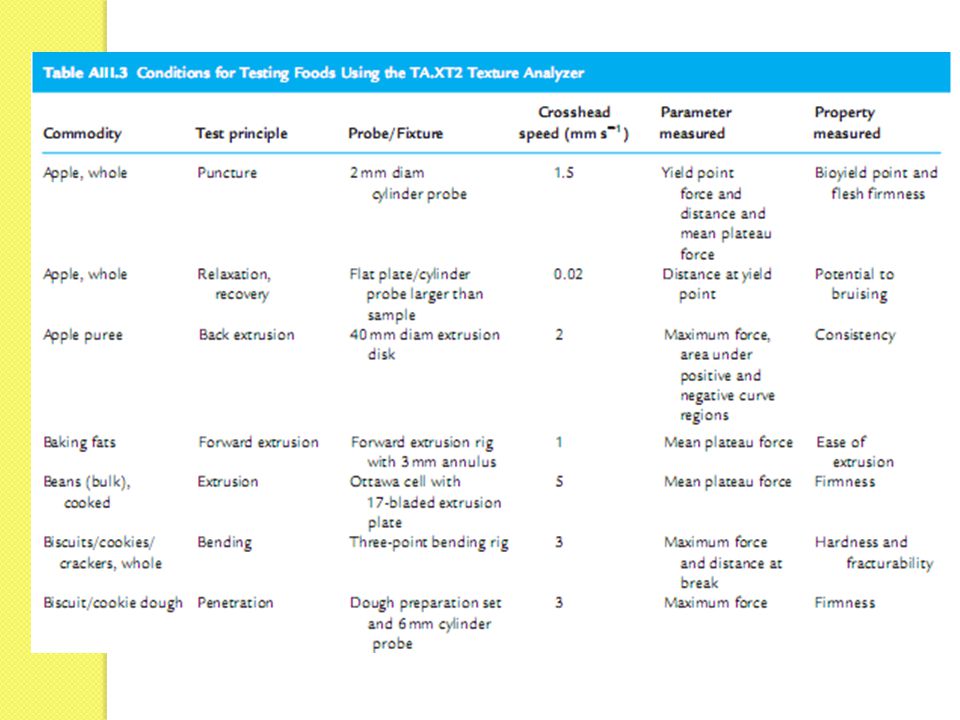

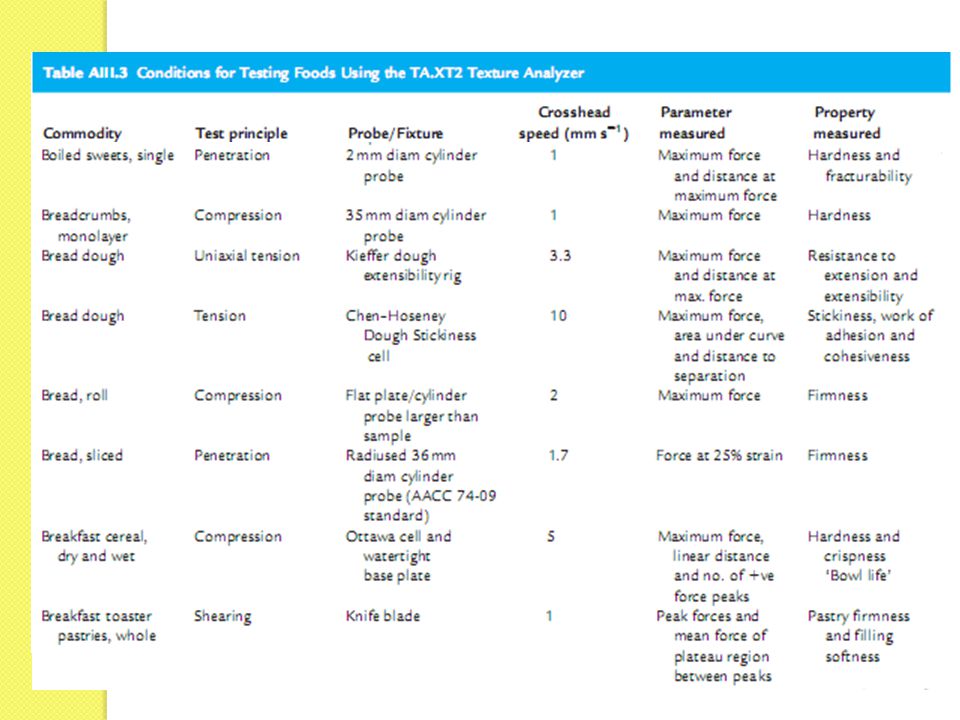
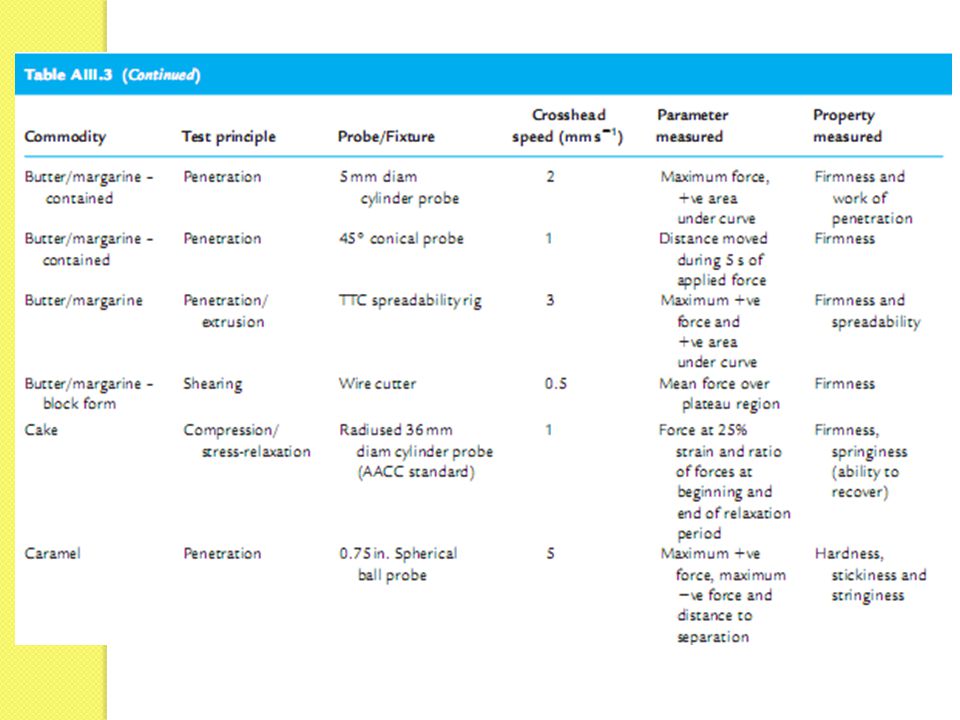
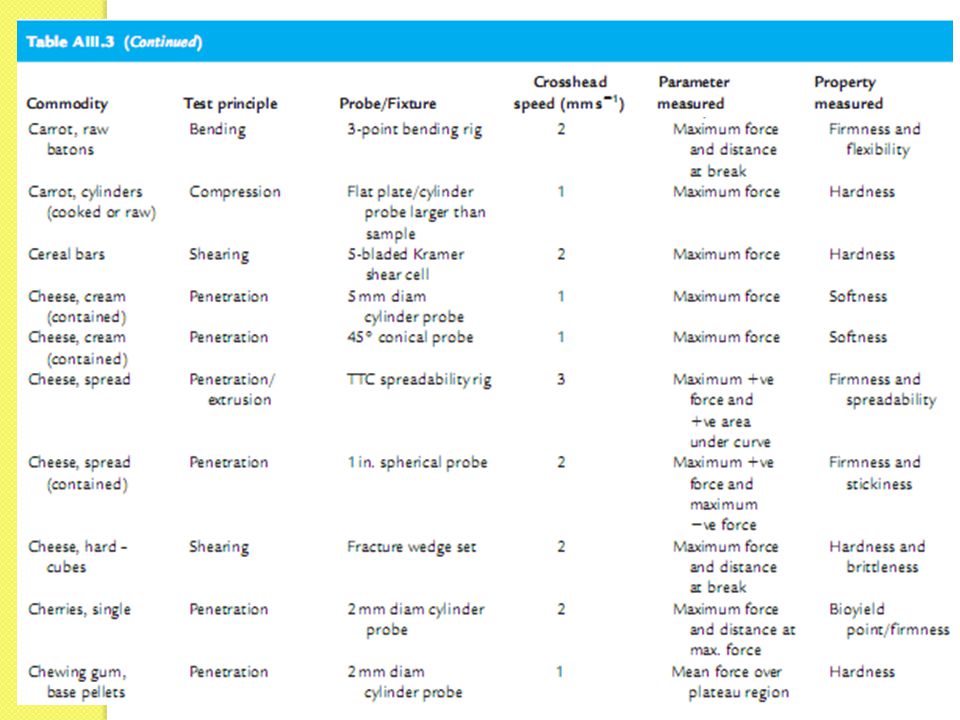


>")


>")


 TTugas/Quis (10 %) UUjian I (mid semester) (40 %) UUjian II (akhir semester)>")