Upload presentasi
Presentasi sedang didownload. Silahkan tunggu

2
Impacts on Suply Arising from Changes In Supply Determinants

3
SUPPLY SHIFTS

6
Price Elasticity of Supply Price elasticity of supply measures how much Q s responds to a change in P. Price elasticity of supply = Percentage change in Q s Percentage change in P

7
Q2Q2 Price Elasticity of Supply Price elasticity of supply equals P Q S P2P2 Q1Q1 P1P1 P rises by 8% Q rises by 16% 16% 8% = 2.0 Price elasticity of supply = Percentage change in Q s Percentage change in P Example:

8
S “Perfectly inelastic” (one extreme) P Q Q1Q1 P1P1 P2P2 Q changes by 0% 0% 10% = 0 Price elasticity of supply = % change in Q % change in P = P rises by 10% Sellers’ price sensitivity: S curve: Elasticity: vertical 0 0
 P Q Q1Q1 P1P1 P2P2 Q changes by 0% 0% 10% = 0 Price elasticity of supply = % change in Q % change in P = P rises by 10% Sellers’ price sensitivity: S curve: Elasticity: vertical 0 0")
9
S “Inelastic” P Q Q1Q1 P1P1 Q2Q2 P2P2 Q rises less than 10% < 10% 10% < 1 Price elasticity of supply = % change in Q % change in P = P rises by 10% relatively steep relatively low < 1 S curve: Sellers’ price sensitivity: Elasticity:

10
S “Unit elastic” P Q Q1Q1 P1P1 Q2Q2 P2P2 Q rises by 10% 10% = 1 Price elasticity of supply = % change in Q % change in P = P rises by 10% intermediate slope intermediate = 1 S curve: Sellers’ price sensitivity: Elasticity:

11
S “Elastic” P Q Q1Q1 P1P1 Q2Q2 P2P2 Q rises more than 10% > 10% 10% > 1 Price elasticity of supply = % change in Q % change in P = P rises by 10% relatively flat relatively high > 1 S curve: Sellers’ price sensitivity: Elasticity:

12
S “Perfectly elastic” (the other extreme) P Q P1P1 Q1Q1 P changes by 0% Q changes by any % any % 0% = infinity Price elasticity of supply = % change in Q % change in P = Q2Q2 P 2 = horizontal extreme infinity S curve: Sellers’ price sensitivity: Elasticity:
 P Q P1P1 Q1Q1 P changes by 0% Q changes by any % any % 0% = infinity Price elasticity of supply = % change in Q % change in P = Q2Q2 P 2 = horizontal extreme infinity S curve: Sellers’ price sensitivity: Elasticity:")
13
13 inelastic supply: P Q D1D1 D2D2 S Q1Q1 P1P1 A B Q2Q2 P2P2 When supply is inelastic, an increase in demand has a bigger impact on price than on quantity.

14
14 elastic supply P Q D1D1 D2D2 S Q1Q1 P1P1 A Q2Q2 P2P2 B When supply is elastic, an increase in demand has a bigger impact on quantity than on price.

15
S How the Price Elasticity of Supply Can Vary P Q Supply often becomes less elastic as Q rises, due to capacity limits. $15 525 12 500 $3 100 4 200 elasticity > 1 elasticity < 1

16
S’ Q2Q2 Raw material prices fall S shifts to S’ Surplus @ P 1 of Q 1, Q 2 Equilibrium @ P 3, Q 3 P Q SD P3P3 Q3Q3 Q1Q1 P1P1 Changes In Market Equilibrium

17
D’S’ Income Increases & raw material prices fall The increase in D is greater than the increase in S Equilibrium price and quantity increase to P 2, Q 2 P Q S P2P2 Q2Q2 D P1P1 Q1Q1 Changes In Market Equilibrium

18
Market for Eggs Q (million dozens) P ( 1970 dollars per dozen) D 1970 S 1970 $0.61 5,500 D 1998 S 1998 Prices fell until a new equilibrium was reached at $0.26 and a quantity of 5,300 million dozen $0.26 5,300
 P ( 1970 dollars per dozen) D 1970 S 1970 $0.61 5,500 D 1998 S 1998 Prices fell until a new equilibrium was reached at $0.26 and a quantity of 5,300 million dozen $0.26 5,300")
19
Market for a College Education Q ( millions of students enrolled)) P ( annual cost in 1970 dollars) D 1970 S 1970 S 1995 D 1995 $4,248 14.9 Prices rose until a new equilibrium was reached at $4,573 and a quantity of 12.3 million students $2,530 8.6
) P ( annual cost in 1970 dollars) D 1970 S 1970 S 1995 D 1995 $4, Prices rose until a new equilibrium was reached at $4,573 and a quantity of 12.3 million students $2,")
20
S 1998 D 1998 D 1900 S 1900 S 1950 D 1950 Long-Run Path of Price and Consumption Changes In Market Equilibrium Quantity Price

21
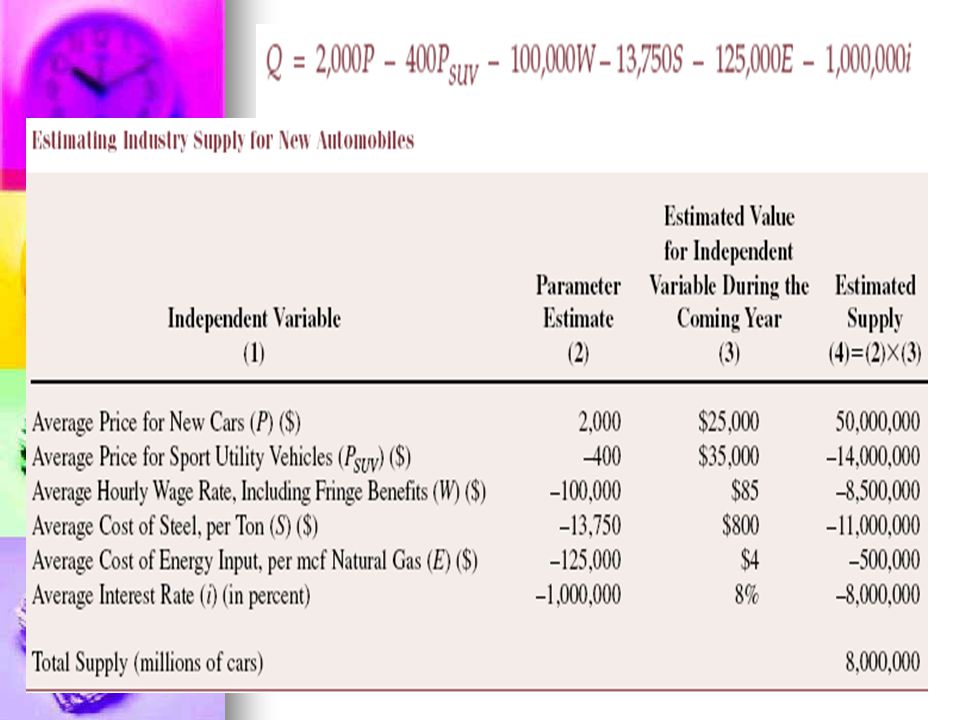
1981 Supply Curve for Wheat Q S = 1,800 + 240P 1981 Demand Curve for Wheat Q D = 3,550 - 266P The Market for Wheat

22
Equilibrium: Q S = Q D The Market for Wheat

23
Elasticities of Supply and Demand The Market for Wheat

24
Elasticities of Supply and Demand Assume the price of wheat is $4.00/bushel The Market for Wheat

25
Demand naik, Supply naik

26
Demand naik, Supply turun

27
Demand turun, Supply turun

28
Applications of Supply and Demand Interference with the Price Mechanism: the effect of a price ceiling the effect of a price floor the effect of a subsidy the incidence of taxes

29
KEBIJAKAN PEMERINTAH DALAM MENSTABILKAN HARGA i.KEBIJAKAN HARGA MAKSIMUM (Price Ceilings) PEMERINTAH MENETAPKAN HARGA MAKSIMUM TERHADAP SUATU PRODUK, SEHINGGA MASYRAKAT DAPAT MEMPEROLEH DENGAN HARGA RENDAH KELEMAHANNYA: Terjadi kelebihan permintaan, timbul pasar gelap, karena pembeli banyak, penjual dapat menjual secara sembunyi-sembunyi Untuk mengatasi pasar gelap: - Menegakkan hukuman dan denda secara tegas - Melakukan penjatahan
 PEMERINTAH MENETAPKAN HARGA MAKSIMUM TERHADAP SUATU PRODUK, SEHINGGA MASYRAKAT DAPAT MEMPEROLEH DENGAN HARGA RENDAH KELEMAHANNYA: Terjadi kelebihan permintaan, timbul pasar gelap, karena pembeli banyak, penjual dapat menjual secara sembunyi-sembunyi Untuk mengatasi pasar gelap: - Menegakkan hukuman dan denda secara tegas - Melakukan penjatahan")
30
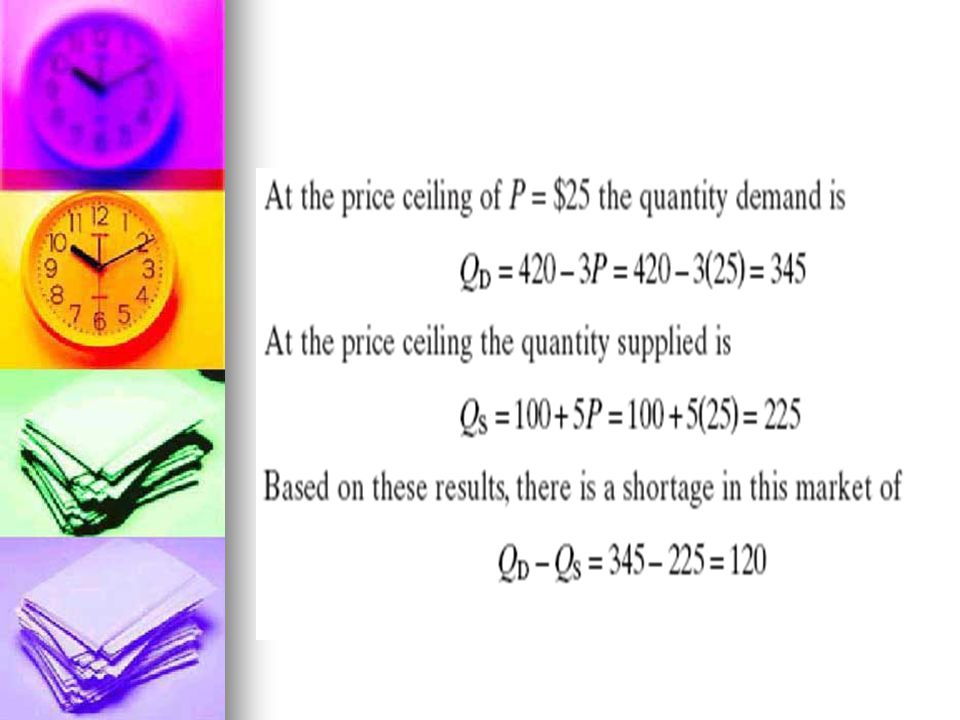
How Price Ceilings Affect Market Outcomes The eq’m price ($800) is above the ceiling and therefore illegal. The ceiling is a binding constraint on the price, and causes a shortage. P Q D S $800 Price ceiling $500 250 400 shortage

31
How Price Ceilings Affect Market Outcomes A price ceiling above the eq’m price is not binding – it has no effect on the market outcome. P Q D S $800 300 Price ceiling $1000

32
How Price Ceilings Affect Market Outcomes In the long run, supply and demand are more price-elastic. So, the shortage is larger. P Q D S $800 150 Price ceiling $500 450 shortage

33
Price ceilling dan Excess Demand

35
KEBIJAKAN PEMERINTAH DALAM MENSTABILKAN HARGA ii.KEBIJAKAN HARGA MINIMUM (Price Floors ) PEMERINTAH MENETAPKAN HARGA MINUMUM ATAU KEBIJAKAN HARGA TERENDAH contoh: Harga Gabah Pemerintah menetapkan harga beli gabah minimum untuk melindungi petani KELEMAHANNYA: Terjadi kelebihan penawaran, untuk ini pemerintah harus membeli gabah atau mengekspor supaya stok gabah di pasar tidak banyak.
 PEMERINTAH MENETAPKAN HARGA MINUMUM ATAU KEBIJAKAN HARGA TERENDAH contoh: Harga Gabah Pemerintah menetapkan harga beli gabah minimum untuk melindungi petani KELEMAHANNYA: Terjadi kelebihan penawaran, untuk ini pemerintah harus membeli gabah atau mengekspor supaya stok gabah di pasar tidak banyak.")
36
How Price Floors Affect Market Outcomes W L D S $4 Price floor $5 The eq’m wage ($4) is below the floor and therefore illegal. The floor is a binding constraint on the wage, and causes a surplus (i.e., unemployment). 400 550 labor surplus
 labor surplus.")
37
How Price Floors Affect Market Outcomes W L D S $4 500 Price floor $3 A price floor below the eq’m price is not binding – it has no effect on the market outcome.

38
Min wage laws do not affect highly skilled workers. They do affect teen workers. Studies: A 10% increase in the min wage raises teen unemployment by 1-3%. The Minimum Wage W L D S $4 Min. wage $5 400 550 unemp- loyment

39
Price floor dan Excess Suypply

40
Kelebihan Penawaran 5 Price floor dan Excess Suypply

41
KEBIJAKAN PEMERINTAH DALAM MENSTABILKAN HARGA iii.KEBIJAKAN SUBSIDI PEMERINTAH MEMBERIKAN SUBSIDI, SUPAYA PENDAPATAN PRODUSEN TIDAK MERUGI contoh: Harga Produk Pertanian Kalau diserahkan pada mekanisme pasar, Harga yang diterima Petani tidak mencukupi untuk mendapatkan pendapatan layak Pemerintah memberi subsidi terhadap produk yang dihasilkan, akibatnya semua petani berupaya meningkatkan produksinya. Kurve penawaran berubah Harga setelah subsidi sebesar P2, Kenaikan produksi menjadi Q1 Pendapatan petani menjadi 0Q1E1P1, subsidi pemerintah P1E1E2P2 Pendapatan petani dengan subsidi menjadi 0Q1E2P2

42
KEBIJAKAN SUBSIDI PENDAPATAN

43
KEBIJAKAN PEMERINTAH DALAM MENSTABILKAN HARGA iv.KEBIJAKAN PAJAK UNTUK MELINDUNGI PRODUK DALAM NEGERI,PEMERINTAH MENGENAKAN PAJAK TERHADAP PRODUK IMPOR DAMPAK KENAIKAN TERGANTUNG PADA: - ELASTISITAS PERMINTAAN - ELASTISITAS PENAWARAN

44
KEBIJAKAN PAJAK ELASTISITAS PERMINTAAN

45
KEBIJAKAN PAJAK ELASTISITAS PENAWARAN

Presentasi serupa


>")


>")

>")