Upload presentasi
Presentasi sedang didownload. Silahkan tunggu

1
Analisis Kinerja Sistem
Teori Antrian - Aurelio Rahmadian -

2
Sifat Antrian Pelanggan tidak menunggu bila ada pelayanan yang menganggur Pelanggan harus menunggu bila layanan sedang digunakan pelanggan lain Pelanggan akan segera memasuki pelayanan bila ada pelanggan yang meninggalkan layanan

3
Analisa Antrian Jumlah waktu yang digunakan untuk berada dalam antrian oleh orang, produk, dll. Menyediakan layanan yang cepat merupakan aspek penting dari kualitas pelayanan Dasar analisa antrian adalah trade-off dari cost yang dibutuhkan untuk meningkatkan pelayanan dan cost yang berhubungan dengan menunggunya customer Analisa antrian merupakan bentuk probabilistik dari analisa Hasil analisa merupakan karakteristik operasi Hasil analisa digunakan oleh manajer operasi antrian untuk mengambil keputusan

4
Cost Trade-off

5
Elemen Antrian Waiting lines form because people or things arrive at a service faster than they can be served. Most operations have sufficient server capacity to handle customers in the long run. Customers however, do not arrive at a constant rate nor are they served in an equal amount of time. Waiting lines are continually increasing and decreasing in length and approach an average rate of customer arrivals and an average service time, in the long run. Decisions concerning the management of waiting lines are based on these averages for customer arrivals and service times. They are used in formulas to compute operating characteristics of the system which in turn form the basis of decision making.

6
Elemen Antrian Komponen dalam antrian: Faktor yang perlu diperhatikan:
Customer Server Faktor yang perlu diperhatikan: Queue Discipline Nature of calling population Arrival rate Service rate

7
Elemen Antrian Queue discipline
Urutan bagaimana customer yang menunggu dilayani Calling population Sumber dari customer (finite atau infinite) Arrival rate Frekuensi customer datang pada antrian, mengacu pada distribusi probabilitas Service rate Rata-rata customer yang dapat dilayani dalam selang waktu tertentu
 Arrival rate. Frekuensi customer datang pada antrian, mengacu pada distribusi probabilitas. Service rate. Rata-rata customer yang dapat dilayani dalam selang waktu tertentu.")
8
Rumus Umum

9
Notasi Kendall A/S/m/B/K/SD Dimana:
A adalah distribusi waktu interarrival S adalah distribusi waktu layanan. m adalah jumlah server B adalah jumlah buffer (sistem kapasitas) K adalah besar populasi SD adalah tertib layanan (service discipline)
 K adalah besar populasi. SD adalah tertib layanan (service discipline)")
10
M/M/1 Ambil :

11
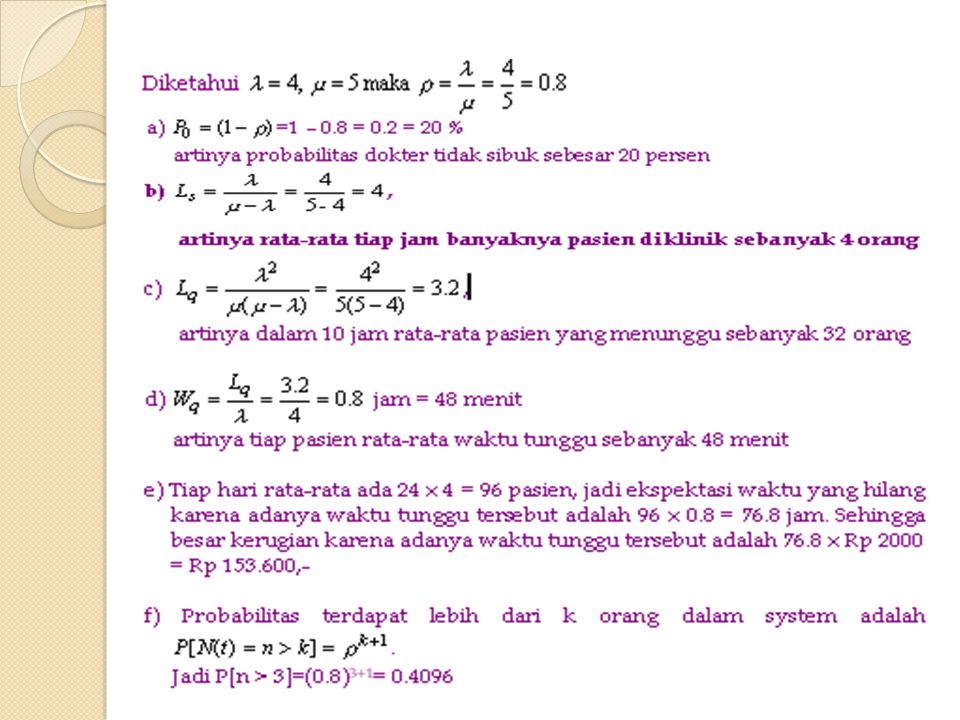
Contoh 1

12
Contoh 1 Antri Layanan Lq = Rata-rata Pelanggan dalam Antrian
Ws = Rata-rata Waktu tunggu dalam Sistem Ls = Rata-rata Pelanggan dalam Sistem Wq = Rata-rata Waktu tunggu dalam Antrian

14
M/M/S

15
M/M/S

16
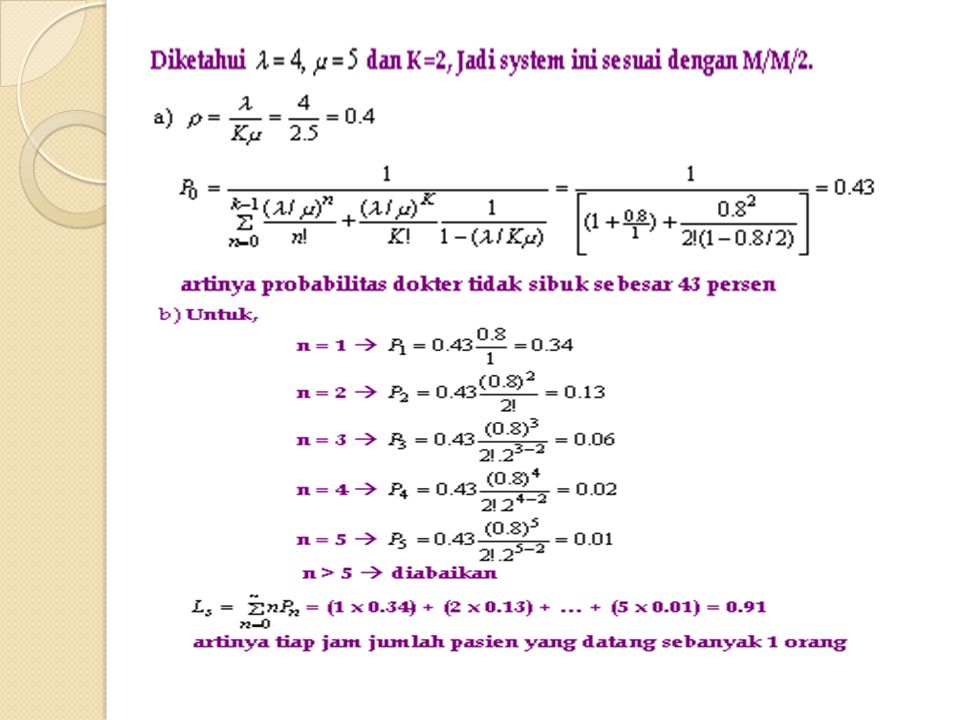
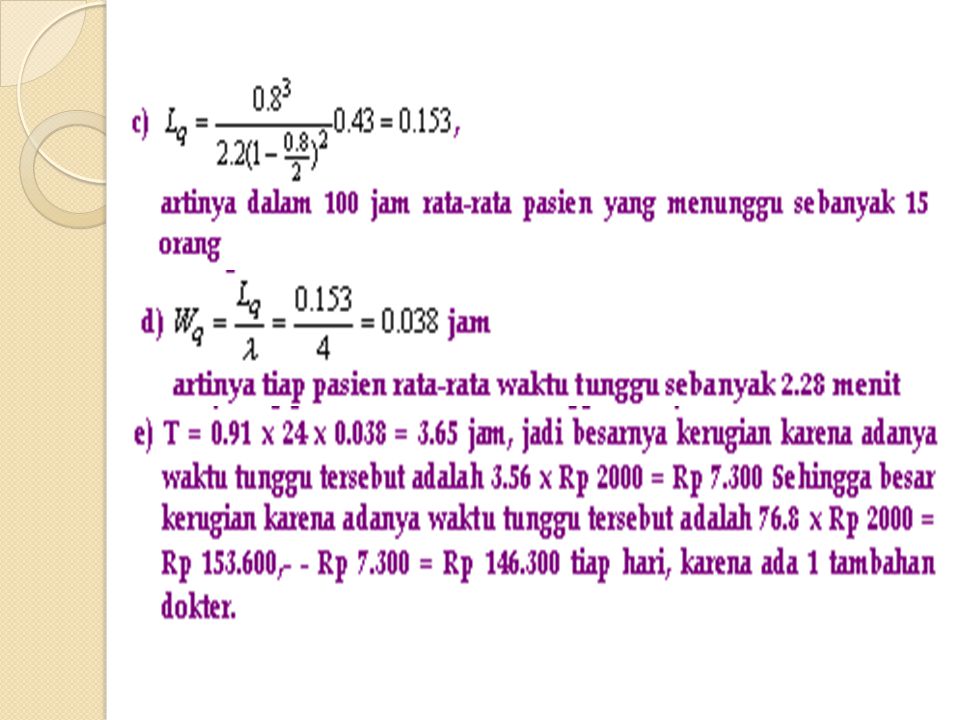
Contoh 2

17
Contoh 2 Antri Layanan Lq = Rata-rata Pelanggan dalam Antrian
= 4 / jam Lq = Rata-rata Pelanggan dalam Antrian Ws = Rata-rata Waktu tunggu dalam Sistem Ls = Rata-rata Pelanggan dalam Sistem Wq = Rata-rata Waktu tunggu dalam Antrian

20
Keputusan Manajerial Present system:
L = 4.00 customers Lq = 3.20 customers W = min Wq = 8.00 min U = 0.80 Cost $150 per week, avoids loss of $75 per week for each minute of reduced customer waiting time Manager wishes to test several alternatives for reducing customer waiting time: Addition of another employee Addition of another checkout counter

21
Keputusan Manajerial Alternative 1: Addition of an employee (raises service rate from = 30 to = 40 customers per hour) System operating characteristics with new parameters: L = 1.5 customers on the average in the queuing system Lq = 0.90 customer on the average in the waiting line W = hour (3.75 minutes) average time in the system per customer Wq = hour ( 2.25 minutes) average time in the waiting line per customer U = .60 probability that server is busy and customer must wait, .40 probability server available Average customer waiting time reduxed from 8 to 2.25 minutes worth $ per week Net savings = $ $150 = $ per week
 average time in the system per customer. Wq = hour ( 2.25 minutes) average time in the waiting line per customer. U = .60 probability that server is busy and customer must wait, .40 probability server available. Average customer waiting time reduxed from 8 to 2.25 minutes worth $ per week. Net savings = $ $150 = $ per week.")
22
Keputusan Manajerial Alternative 2: Addition of a new checkout counter ($6,000 plus $200 per week for additional cashier) =24/2 = 12 customers per hour per checkout counter = 30 customers per hour at each counter System operating characteristisc with new parameters: L = 0.67 customer in the queuing system Lq = 0.27 customer in the waiting line W = hour (3.33 minutes) per customer in the system Wq = hour (1.33 minutes) per customer in the waiting line U = .40 probability that a customer must wait P0 = .60 probability that server is idle and customer can be served Savings from reduced waiting time worth $500 per week - $200 = $300 net savings per week After $6,000 recovered, alternative 2 would provide $ = $18.75 more savings per week
 per customer in the system. Wq = hour (1.33 minutes) per customer in the waiting line. U = .40 probability that a customer must wait. P0 = .60 probability that server is idle and customer can be served. Savings from reduced waiting time worth $500 per week - $200 = $300 net savings per week. After $6,000 recovered, alternative 2 would provide $ = $18.75 more savings per week.")
23
Keputusan Manajerial Operating Characteristics for Each Alternative System Cost trade-offs for service levels

24
Waiting Line Psychology
Waits with unoccupied time seem longer Pre-process waits are longer than process Anxiety makes waits seem longer Uncertainty makes waits seem longer Unexplained waits seem longer Unfair waits seem longer than fair waits Valuable service waits seem shorter Solo waits seem longer than group waits Maister, The Psychology of Waiting Lines, teaching note, HBS

Presentasi serupa


>")


>")


 B A B IV>")

