Upload presentasi
Presentasi sedang didownload. Silahkan tunggu

1
Fundamental of Technical Analysis

2
Special Thanks To Mr. Mochammad Yusuf (Chairman Asosiasi Analis Teknikal Indonesia)/ Mr. Imran S Dalimi Mr. Riza Wibawa

3
Percentage retracements
All trends are subject to price retracements and reversals. Trend analysis should help you identify trend reversals.

4
Bullish Trend Dikatakan Bullish jika harga membentuk pola HH (higher high) dan HL (Higher Low) dimana harga selalu membuat new high. Jika terjadi koreksi/penurunan tidak pernah melampaui harga low dari koreksi sebelumnya
 dan HL (Higher Low) dimana harga selalu membuat new high. Jika terjadi koreksi/penurunan tidak pernah melampaui harga low dari koreksi sebelumnya.")
5
Bullish Trend HH HL

6
Bullish Reversal Point
HH LH LL HL Reversal Point Note: Reversal point ketika harga menembus trough sebelumnya

7
Bearish Trend Dikatakan Bearish jika harga membentuk pola LH (Lower High) dan LL (Lower low) dimana harga selalu membuat new Low. Jika terjadi koreksi/Kenaikan tidak pernah melampaui harga high dari koreksi sebelumnya
 dan LL (Lower low) dimana harga selalu membuat new Low. Jika terjadi koreksi/Kenaikan tidak pernah melampaui harga high dari koreksi sebelumnya.")
8
Bearish Trend LH LH LL LH LH LL LL LL LL

9
Bearish Reversal Point
LL HL LH HH Reversal Point Note: Reversal point ketika harga menembus peak sebelumnya

10
Sideways HH HL Kondisi sideways biasanya ditandai dengan terbentunknya “Chart Pattern”

11
Aturan Volume Volume terhadap trend, ketika trend naik diikuti trend volume naik, menandakan banyaknya partisipasi pelaku pasar dalam kenaikan harga. Ini menandakan adanya ekses demand (demand membesar dan supply terbatas) sehingga harga naik. Dan karena antusias para pembeli maka kenaikan harga diikuti kenaikan volume, Ceteris Paribus
 sehingga harga naik. Dan karena antusias para pembeli maka kenaikan harga diikuti kenaikan volume, Ceteris Paribus.")
12
Ideal Healthy Price Uptrend
Vol. Up Price Down Vol. Down

13
Ideal Healthy Price Downtrend
Vol. Up Price Up Vol. Down

14
Blow off Volume – A Warning Signal (The Bull Case)
Extreme high volume

15
Blow off Volume – A Warning Signal (The Bear Case)
Extreme high volume

16
Aturan Volume Volume terhadap pola. Volume juga dapat digunakan menganalisa sebua pola yang terjadi. Ketika sebuah pola terbentuk, maka peningkatan dan penurunan volume pada puncak-punca dan atau lembah-lembah pola menjadi konfirmasi validitas sebuah pola Volume pada breakout pola. Volume juga digunakan untuk mengkonfirmasi akurasi breakout pada sebuah pola. Ketika breakout baik naik maupun turun, bila diikuti peningkatan volume menandakan akurasi breakout tersebut. Bila sebuah breakout tidak diikuti volume maka kita perlu berhati-hati mengikuti atau berpartisipasi pada breakout tersebut Metastock-ID

17
Kekuatan Support and Resistance Level
Volume yang terjadi di garis Support atau Resistance. Pergerakan harga waktu tembus Support atau Resistance yang di ikuti volume besar. Waktu untuk pembentukan support and resistance baik sebelum maupun sesudah di tembus. Pergerakan harga yang cepat ketika meningalkan Support atau Resistance area. Ketika Support berubah fungsi menjadi Resistance dan sebaliknya ketika Resistance berubah fungsi menjadi support. Angka bulat atau cantik menjadi support and resistance. Metastock-ID

18
Fibonacci Ratio 233/144 = 1,618 377/233 = 1,618 610/377 = 1,618
Angka Fibonacci: 0, 1, 1, 2, 3, 5, 8, 13, 21, 34, 55, 89, 144, 233, 377, 610, 987, 1597, 2584, …. Didapat dari menjumlahkan 2 bilangan sebelumnya Golden Ratio (1.618) didapat dengan membagi angka setelah deret ke 13 dengan angka sebelumnya 233/144 = 1,618 377/233 = 1,618 610/377 = 1,618
 didapat dengan membagi angka setelah deret ke 13 dengan angka sebelumnya. 233/144 = 1, /233 = 1, /377 = 1,618.")
19
The Golden Ratio The key Fibonacci ratio of 61.8% - also referred to as “the golden ratio” or “the golden mean” – is found by dividing one number in the series by the number that follows it. For example: 8/13 = and 55/89 = The 38.2% ratio is found by dividing one number in the series by the number that is found two places to the right. For example: 55/144 = The 23.6% ratio is bound by dividing one number in the series by the number that is three places to the right. For example: 8/34 = 55 19

20
Fibonacci ratios in the markets
For some reason, these ratios seem to play an important role in the financial markets, just as they do in nature, and can be used to determine critical points that cause price to reverse. Price has an uncanny way of respecting Fibonacci ratio’s, often quite precisely. Hence one can use the Fib ratios to ascertain the correct technical levels. Frankly there is nothing magical about these numbers, and price reacts at these levels simply because a majority of traders are following the ratios. 55 20

21
Retracement Analysis Obvious Not obvious

22
Fibonacci Retracement
The basic use of Fibonacci retracements is to find potential levels of support or resistance “behind” the market. If the market is moving up and making new highs, Fib retraces will draw levels BELOW the current price. Ideal situation to use in – To estimate the horizontal levels of support/resistance for a pullback in an existing trend. 55 22

23
Fibonacci Retracement
Sell Jika Market Bearish angka 0 ditempatkan di Low dan angka 100 ditempatkan di harga High. Posisi yang diambil adalah sell ketika menyentuh retracement 2/3 atau 61.8

24
Fibonacci Retracement
Buy Jika Market bullish angka 0 ditempatkan di high dan angka 100 ditempatkan di harga low Posisi yang diambil adalah sell ketika menyentuh retracement 2/3 atau 61.8

25
Expansions - Extensions
When a rebound from retracement of a previous trend exceeds the previous high (in an uptrend) or low (in a downtrend), erase the old retracements and apply extensions.
 or low. (in a downtrend), erase the. old retracements and. apply extensions.")
26
Fibonacci Multipliers
Fibonacci divisions are divisions of 1. Fibonacci expansions are Fibonacci ratios, which when multiplied equal 1. .236 * 4.236 .382 * 2.618 .5 * 2 .618 * 1.618 .764 * 1.309

27
Expansions - Extensions
Retracement ratios are equally valued for targeting prices on extensions. In the case of the Gann ratios, the extensions will be placed at: 1.125, 1.25, 1.375, 1.5, 1.625, 1.75 and In the case of the Fibonacci ratios, the extensions will be placed at: 1.382, 1.5 and

28
Expansions - Extensions
The Fibonacci expansion is a great tool for establishing profit targets. It offers a distinct advantage over the other usual fib ratios, since it isn’t as widely used by traders. Rather than drawing levels “behind” the market, the fib expansions draw them in “front” of the market. In other words, if the market is moving up and making new highs, the standard fib retracements will draw levels BELOW the current price, but the fib expansions will draw levels ABOVE the current price.

29
Expansions - Extensions

30
Plotting Fibonacci Expansion
For plotting the Fibonacci Expansions you need 3 points, and the basic technique for an uptrend, is to plot it off a Low, and High and a Higher Low (or for down trends - a High, a Low and a Lower High). 55 30
")
31
Plotting Fibonacci Expansion
We measure the distance from Point A to Point B. However, we can’t project price targets until Point C has been established. Only when Point C has been formed do we have the necessary three swing points. In short, we identify a trend that has started and pulled back, forming Points A and B, and wait for Point C to form. Once Point C has formed, we plot the Fibonacci Expansion Tool on Point A, Point B, and Point C. 55 31

32
Fibonacci Multipliers Application
Assume B-A = .382 Multiplier of .382 = 2.618 If B-A = 100 points, then the target becomes 261.8 Add to A The target is very aggressive B A

33
Extend Retracement from Pullback
C to D = (B – A) *.618 or 1 or 1.618 Long-term targets A C D B B D C A
 *.618. or 1 or Long-term targets. A. C. D. B. B. D. C. A.")
34
Use of the Fibonacci Expansion
1.) To determine the future levels of resistance (in case of an uptrend) We can plot the FE levels within any price wave which gives us the 3 points as required – a swing low, a swing high into the uptrend, and then a pullback giving a lower high. (An important point to note is that, the third point should be a higher low. In case this pullback goes below the previous swing low, the situation does not warrant the use of a Fib expansion.) In such cases, as mentioned earlier, a safe entry into the long trade would be the break of the FE 78 level, with the stop beneath the third point (the higher low), and targeting the future fib levels. Hence we can calculate the Risk-to-Reward ratio, and also decide where to take partial profits, and where to exit the trade. 55 34
 To determine the future levels of resistance (in case of an uptrend) We can plot the FE levels within any price wave which gives us the 3 points as required – a swing low, a swing high into the uptrend, and then a pullback giving a lower high. (An important point to note is that, the third point should be a higher low. In case this pullback goes below the previous swing low, the situation does not warrant the use of a Fib expansion.) In such cases, as mentioned earlier, a safe entry into the long trade would be the break of the FE 78 level, with the stop beneath the third point (the higher low), and targeting the future fib levels. Hence we can calculate the Risk-to-Reward ratio, and also decide where to take partial profits, and where to exit the trade")
35
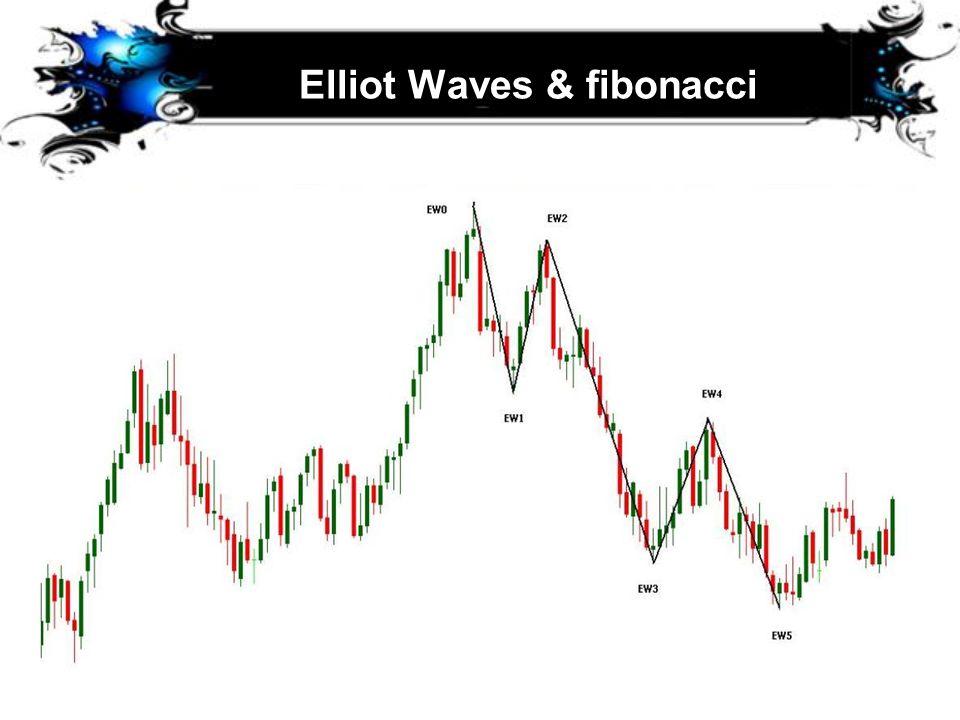
Elliot Waves & fibonacci
55 35
36
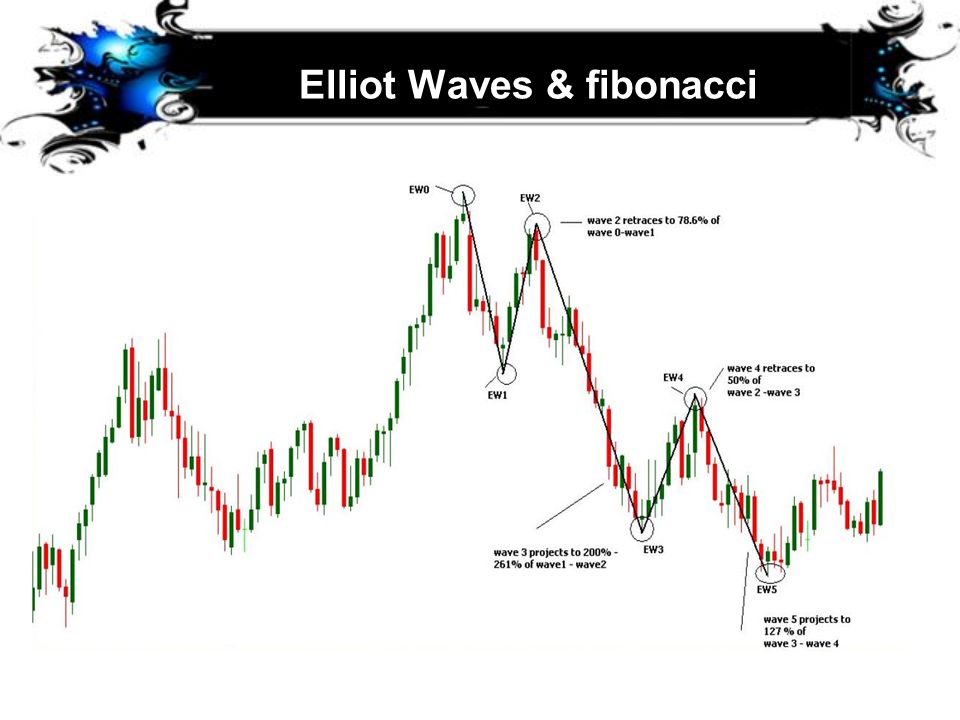
Elliot Waves & fibonacci
The Elliot waves always form within the parameters of the Fibonacci retracements and Fibonacci projections. Wave 2 is a sharp correction, which should retrace wave 1 by about 61.8% or 78.6% by price distance. Wave 3 would often be 200.0% to 261.8% projection of wave 1 – wave 2 by price distance. Wave 4 will very often retrace about 38.2% to 61.8% of wave 3 by price distance. Wave 5 would often be 127.2% to 161.8% projection of wave 3 by price distance. This last impulse wave 5 forms with reducing momentum thus creating a divergence setup. 55 36

37
Elliot Waves & fibonacci
55 37
Presentasi serupa


>")

 (Part 2)>")


 Hidsal Jamil(135020100111028) Padel Aji Pamungkas(135020100111042)>")