Upload presentasi
Presentasi sedang didownload. Silahkan tunggu

2
Prescribing cascade and Pharmaco-economics Dep. Farmakologi dan Terapeutik, Fakultas Kedokteran Universitas Sumatera Utara

3
Prescription Drug Use: Harms Medications have the potential for harm as well as benefit and adverse drug events (ADE) are common. An ADE is an injury from a medication. Annually 35% of community-dwelling elders experienced an ADE, 29% required health care services. Adverse drug events responsible for 5-28% of acute hospitalizations among geriatric patients. In nursing home residents, 51% of ADEs were found to be preventable.

4
Visiting Findings Percentage

5
Polypharmacy Causes and Consequences Contributing factors – Age – Multiple medical conditions – Multiple symptoms – Copious prescribing – Multiple providers – Multiple pharmacies used – Self treating – Drug regimen changes – Prescribing cascade Consequences – Adverse drug events – Noncompliance – Increased cost

6
Interaksi obat yang menakutkan 1.banyaknya obat baru yang informasi tentang interaksinya dengan obat lain masih terbatas 2.semakin banyak obat yang dapat diperoleh tanpa resep dokter 3.meningkatnya usia harapan hidup manusia menyebabkan meningkatnya kelompok masyarakat yang membutuhkan perlakuan dengan polifarmasi. 4.Harga obat melambung yang diikuti dengan iatrogenic cost

7
Lethal Combination of Tramadol and Multiple Drugs Affecting Serotonin Ripple MG. et al. Am J For Med Path. 21(4):370-4,2000 The threshold for seizures is lowered by tramadol. In addition, the risk for seizure is enhanced by the concomitant use of tramadol with selective serotonin reuptake inhibitors or neuroleptics. The cause of death in this individual was seizure activity complicating therapy for back pain and depression
:370-4,2000 The threshold for seizures is lowered by tramadol. In addition, the risk for seizure is enhanced by the concomitant use of tramadol with selective serotonin reuptake inhibitors or neuroleptics. The cause of death in this individual was seizure activity complicating therapy for back pain and depression.")
8
Potential Drug Interactions Number of Drugs Interactions Number of Interactions 1 0 2 A+B1 3 A+B A+C B+C 3 4 A+B A+C A+D B+C B+D C+D 6

9
Potential Drug Interactions

10
PRESCRIBING CASCADE Kaskade Peresepan PRESCRIBING CASCADE obat 2 efek samping obat efek samping obat diinterprestasikan sebagai suatu kondisi klinis baru obat 1 Rochon PA, Gurwitz JH. BMJ. 315:1096-9,1997. Drug 1 Adverse drug effect misinterpreted as new medical condition Adverse drug effect Drug 2

11
Kaskade pengobatan di masyarakat

12
Nyeri dengkul laksansia OAINS dst antasida diare Nyeri ulu hati terapi ikutan Simtom baru terapi Keadaan awal Kaskade peresepan di klinik pribadi konstipasi

13
Hipertensi remato- logis OAINS gastro- entero- logis misoprostol serangan GOUT PSMBA diare..... hidro kloro- tiazida IATROGENIK (iatro = dokter)
.")
14
Examples of prescribing cascade Initial treatment Adverse effect Subsequent treatment Non-steroidal anti- inflammatory drugs Rise in blood pressure Antihypertensive treatment Thiazide diuretics HyperuricaemiaTreatment for gout Metoclopramide treatment Parkinsonian symptoms Treatment with levodopa

15
Odds rasio pada pengobatan awal dengan: antihipertensi sebagai terapi lanjutan setelah pemberian OAINS obat anti-gout sebagai terapi lanjutan setelah pemberian tiazid anti-Parkinson sebagai terapi lanjutan setelah pemberian metoklopramide

16
Anti- hipertensi antasida NYERI diuretik misoprostol Retensi cairan TD meningkat Nyeri ulu hati GGN GI TRACT OAINS Prescribing CascadeKaskade Peresepan

17
Lingkaran setan … Lansia Bermacam- macam problem klinis Poly- pharmacy efek samping terapi lanjutan tanda/ simptom baru ? Poli- farmasi

18
Rp PAIN Rp fluid retention increase BP heart burn PUB NSAID=Rp Iatrogenic Cost ALZHEIMER DISEASE CANCER

19
Upaya meminimalisasi kaskade peresepan di rumah sakit menegakkan diagnosa kerja dengan cermat melakukan pendekatan non-farmakologi menggunakan pengobatan sederhana yang efektif dengan dosis paling rendah kurangi dosis yang diberikan mencoba obat pilihan lain pertimbangkan dengan seksama penambahan obat baru yang benar-benar dibutuhkan dan aman

20
Sikap Farmasis dalam menghadapi kombinasi obat akibat kaskade peresepan Farmasis harus peduli tentang reaksi sampingan disamping indikasi, dosis dan cara pemberian suatu obat Farmasis harus peduli dengan pertambahan ragam item obat dibandingkan dengan pada awal pengobatan Farmasis harus mencurigai pertambahan obat untuk terapi simptomatis sebagai kaskade peresepan Farmasis harus waspada terhadap interaksi obat yang merugikan akibat kaskade peresepan Farmasis perlu mengingatkan dokter akan kemungkinan buruk akibat kaskade peresepan

21
PharmacoEconomics Adding drugs to the formulary involves careful consideration of: – Efficacy – Safety – Quality – Cost Cost factors are becoming more important Science of pharmacoeconomics is emerging – Pharmacoeconomics – Cost (total resources consumed in producing a good or service) – Price (the amount of money required to purchase an item)
 – Price (the amount of money required to purchase an item)")
22
Adding drugs to the formulary clinicavailableIntroduced GI ulcerH2-antagonistPPI ArthritisNSAIDCOXIB, anti-TNF agents Mental health TCASSRIs, Atypical Anti-Psychotics Women’s health - (osteoporosis)biphosphonate AIDS-Protease Inhibitors/cocktail
biphosphonate AIDS-Protease Inhibitors/cocktail")
23
Medical Outcomes ECHO Model ClinicalHumanisticEconomic Cure Comfort Survival Physical Emotional Social Expense Savings Cost Avoidance

24
outcomes research pharmaco- economics pharmaceutical care Relationship between Outcomes, Pharmacoeconomics and Pharmaceutical Care

25
Definition Economic outcomes measure that focuses on the evaluation of pharmaceutical products and pharmaceutical services Economic Clinical Humanistic

26
cost-minimisation cost-benefit Pharmacoeonomics cost-utility cost-effectiveness

27
Cost-Minimization Analysis Compares the total relevant cost-difference between treatment alternatives (products or services) that are considered to produce identical outcomes Economic Clinical Humanistic
 that are considered to produce identical outcomes Economic Clinical Humanistic")
28
Cost-Minimization Analysis Examples: comparing an AB rated generic drug to its brand name equivalent comparing the cost of a multiple dose schedule to a once daily schedule that is equally safe and effective analyzing the cost of administering and monitoring the same drug in two different settings

29
Generically Equivalent Pharmaceutically equivalent Therapeutically equivalent The same drug with the same effect, but the product is from a different manufacturer AB rating in “Orange Book”

30
Cost-Effectiveness Analysis Compares the total relevant cost of therapy to the effectiveness when the outcomes for the alternatives are NOT equal Economic Clinical Economic Clinical Humanistic

31
Cost-Effectiveness Cost-effectiveness = Good Value Cost effective strategy may NOT save money Saving money is NOT always cost-effective – original vs. me too

32
Cost-Effectiveness Analysis Difference in costs IV I The new treatment is Less effective and more more effective and expensive more expensive Difference in effects III II The new treatment is less effective and more effective and less expensive The four possible qualitative results in a cost effectiveness analysis

33
Comparative Bioavailability Study of Two Different Nimesulide- Containing Preparations Available on the Italian Market V. Hutt, J. Waitzinger, F. Macchi Clin Drug Invest 21(5):361-369, 2001.
: ,")
34
In vitro dissolution data of Aulin® and Nimesulide Dorom tablets Drug product Percentage of nimesulide dissolved 15 min30 min Aulin®89.2598.45 Nimesulide Dorom 52.4363.85

35
Plasma concentrations (arithmetic means z = terminal rate constant. SD) of nimesulide after single oral administration of Aulin® and Nimesulide Dorom 100mg to healthy volunteers (n = 18).
 of nimesulide after single oral administration of Aulin® and Nimesulide Dorom 100mg to healthy volunteers (n = 18)..")
36
Cost-Effectiveness Analysis Less $More $ Worse AB outcome Better CD outcome

37
Cost Utility Analysis Evaluates the value of an intervention or a program against the value of the outcome in terms of quality-adjusted life years (QALYs) Economic Clinical Humanistic
 Economic Clinical Humanistic")
38
Cost Utility Analysis Incremental Cost Utility Ratio (ICUR) ICUR = Cost drug A - Cost drug B QALY drug A - QALY drug B QALY = length of life × quality of life
 ICUR = Cost drug A - Cost drug B QALY drug A - QALY drug B QALY = length of life × quality of life")
39
Cost Utility Analysis Example: _____________________________________________________ Total Years of x Utility = QALYs CU Cost Life (LYs) Ratio Drug A $20,000 3.5 0.75 2.6 $7619/QALY Drug B $16,000 2.5 0.80 2.0 $8000/ QALY _____________________________________________________
 Ratio Drug A $20, $7619/QALY Drug B $16, $8000/ QALY _____________________________________________________")
40
Cost-Benefit Analysis Evaluates the value of all resources consumed in implementing a program or intervention against the value of the outcome Economic Clinical Humanistic

41
Cost-Benefit Analysis Example: _____________________________________________ Cost Benefit Average B:C Ratio New Benefit/Cost Service $25,000 $45,000 1.8:1 _____________________________________________

42
Commonly Prescribed Drugs Anti-inflammatory agents Analgesic agents Antimicrobial agents (antibiotics, antifungal, antiviral) Corticosteroids Antianxiety/sedative agents **Adjuvant analgesic agents**
 Corticosteroids Antianxiety/sedative agents **Adjuvant analgesic agents**")
43
Outcome Measures DiseaseIndicator Clinical Outcome Humanistic Outcome Economic Outcome Hypertension BP Renal failure Stroke MI Death QOL Cost/ mmHg BP Cost/stroke avoided Cost/life year saved Hyperlipidemia LDL levels Angina MI Death QOL Cost/MI avoided Cost/point in LDL Diabetes A1C BG levels Retinopathy Nephropathy Death QOL Cost/change in A1C Cost/kidney transplant avoided Asthma FEV, peak flow Exacerbation event Death QOL Cost/symptom free day

44
Outcome Measures for pain management CELECOXIB Less CV event QOL Cost >> Agent Indicator Clinical Outcome Humanistic Outcome Economic Outcome NSAIDpain CV event GI event Renal failure QOL Cost/ mmHg BP Cost/stroke avoided Cost/life year saved IBUPROFEN Better GI event QOL Cost <<

45
Pharmacoeconomics $$ Effectiveness + - - - _ say YES do it! Now what ? say NO +++ New Medications New Medications

46
MOST EXPENSIVE THERAPY THERAPEUTIC FAILURE

47
sekitar 90% penderita akan merasa lebih sehat meskipun dokter tidak melakukan sesuatu oleh karena itu pertama sekali jangan bikin celaka! first do no harm!

48
Medical License “ My name is Bond, James Bond OO7, I have License to kill” “ Medical profession has a better License, to save and also to kill”

49
kepada pasien yang tidak tahu apa-apa terhadap penyakit yang aku pahami Aku telah memberikan obat yang aku kenal KEBANGGAAN INDONESIA UNTUK DUNIA

50
Treatment cost for pneumonia Long-term study, CCP-DPS GMU, December 1997 – March 2002

51
Pharmaceutical spending, as % of total health spending, is greatest in developing countries

53
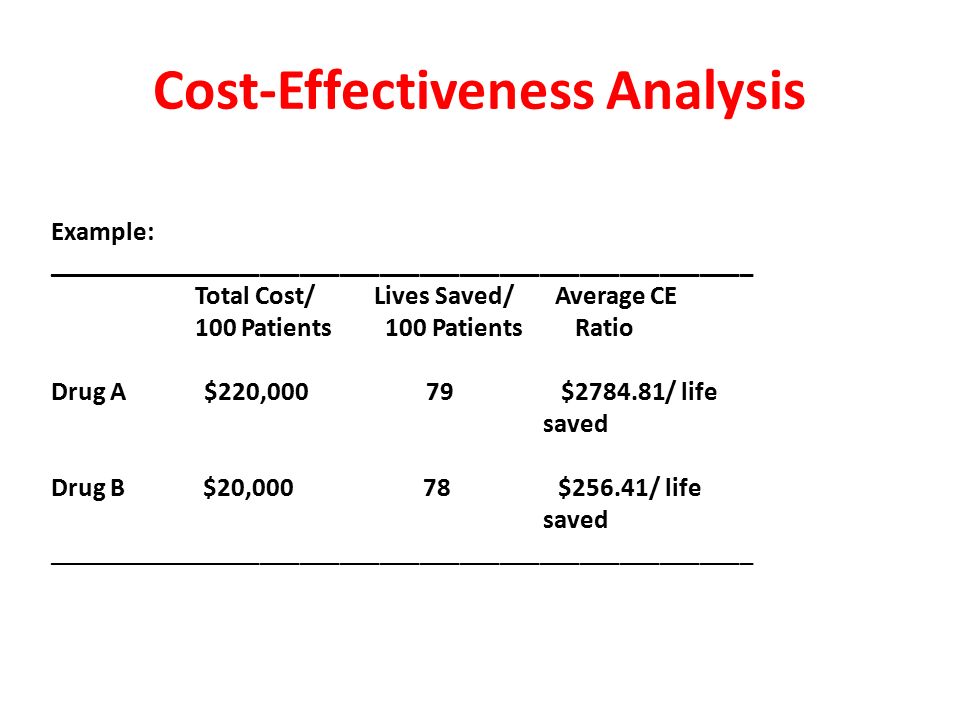
Cost-Effectiveness Analysis Example: _____________________________________________________ Total Cost/ Lives Saved/ Average CE 100 Patients 100 Patients Ratio Drug A $220,000 79 $2784.81/ life saved Drug B $20,000 78 $256.41/ life saved _____________________________________________________

54
Cost-Effectiveness Analysis Incremental Cost Effectiveness Ratio (ICER) ICER = (cost of A – cost of B) (effectiveness of A – effectiveness of B) ICER = $220,000 - $20,000 79 Lives - 78 Lives = $200,000 / live saved
 ICER = (cost of A – cost of B) (effectiveness of A – effectiveness of B) ICER = $220,000 - $20, Lives - 78 Lives = $200,000 / live saved")
55
pharmacotherapeutics Therapeutic effect Adverse effect MinimalMaximal Yes? Minimal ? No

56
Critical evaluation on selecting medicine $$ ADRs Effectiveness + - - - _ say YES do it! Now what ? say NO +++ New Medications New Medications

57
Is evidence really evidence? The Evidence Pyramid META-ANALYSIS DB RCT In vitro (“test tube”) research Animal research Ideas, editorials, opinions Case reports Case series Case control studies Cohort studies RCT
 research Animal research Ideas, editorials, opinions Case reports Case series Case control studies Cohort studies RCT.")
58
Very few studies have been published at the time of approval!

59
Many People Involved in Pharmaceutical Supply-Chain Wholesalers Generics Branded Drug Cos PBMS Insurers Clinicians Patients Providers Employers Govt’

60
Types of Pharmacoeconomic Analysis MethodologyCost measurement unit Outcome unit Cost minimizationDollarsVarious- but equivalent in comparative groups Cost benefitDollars Cost effectivenessDollarsNatural units (life years, mg/dl blood sugar, LDL cholesterol) Cost utilityDollarsQuality adjusted life years
 Cost utilityDollarsQuality adjusted life years")
61
Perspective pharmaco-economics The “point of view” considered in economic analyses influences the outcomes and costs considered to be most relevant: – Provider – Patient – Payer – Society

Presentasi serupa


 dan Pembelajaran Konvensional.>")


