Upload presentasi
Presentasi sedang didownload. Silahkan tunggu

1
STATISTIKA CHATPER 4 (Perhitungan Dispersi (Sebaran))
4-1 Range 4-2 Quartil , Desil, Persentil 4-3 Standar Deviasi 4-4 Variance SULIDAR FITRI, M.Sc March 18,2014 STMIK AMIKOM Yogyakarta

2
UKURAN DISPERSI Suatu metode analisis yang ditujukan untuk mengukur besarnya penyimpangan / penyebaran dari distribusi data yang diperloleh terhadap nilai sentralnya. Istilah Dispersi = Sebaran (Spread/ variation) Jika semua nilai data sama, maka data tersebut sama dengan rata-ratanya dan tidak ada variasi/sebaran data Variasi data ada apabila beberapa nilai data berbeda dari nilai rata-rata. We will discuss the following measures of spread: range, quartiles, variance, and standard deviation
 Jika semua nilai data sama, maka data tersebut sama dengan rata-ratanya dan tidak ada variasi/sebaran data. Variasi data ada apabila beberapa nilai data berbeda dari nilai rata-rata. We will discuss the following measures of spread: range, quartiles, variance, and standard deviation.")
3
RANGE Salah satu cara untuk mengukur nilai sebaran adalah dengan mendapatkan nilai terkecil (minimum) dan terbesar (maximum) dalam dataset. Range = max min Nilai Range sangat dipengaruhi oleh data outlier

4
Basic Practice of Statistics - 3rd Edition
Quartiles Three numbers which divide the ordered data into four equal sized groups. Q1 has 25% of the data below it. Q2 has 50% of the data below it. (Median) Q3 has 75% of the data below it. Chapter 2 BPS - 5th Ed. Chapter 2
 Q3 has 75% of the data below it. Chapter 2. BPS - 5th Ed. Chapter 2.")
5
Quartiles Uniform Distribution
Basic Practice of Statistics - 3rd Edition Quartiles Uniform Distribution Q1 Q2 Q3 BPS - 5th Ed. Chapter 2 Chapter 2

6
Obtaining the Quartiles
Basic Practice of Statistics - 3rd Edition Obtaining the Quartiles Order the data. For Q2, just find the median. For Q1, look at the lower half of the data values, those to the left of the median location; find the median of this lower half. For Q3, look at the upper half of the data values, those to the right of the median location; find the median of this upper half. Chapter 2 BPS - 5th Ed. Chapter 2

7
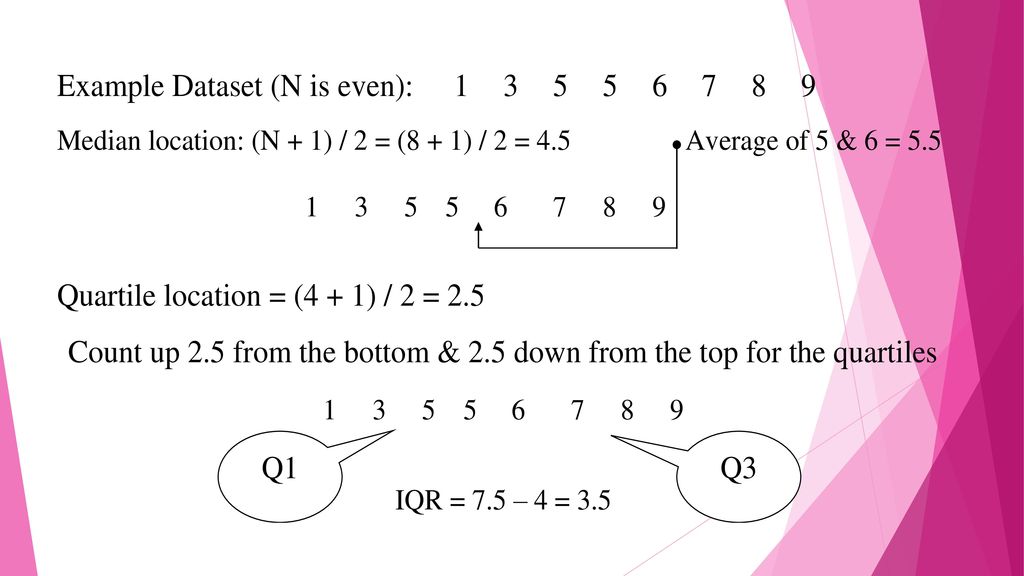
Cara Menemukan Quartil:

9
RUMUS LAIN:

10
Basic Practice of Statistics - 3rd Edition
Weight Data: Sorted L(M)=(53+1)/2=27 L(Q1)=(26+1)/2=13.5 Chapter 2 BPS - 5th Ed. Chapter 2
=(53+1)/2=27. L(Q1)=(26+1)/2=13.5. Chapter 2. BPS - 5th Ed. Chapter 2.")
11
Weight Data: Quartiles
Basic Practice of Statistics - 3rd Edition Weight Data: Quartiles Q1= 127.5 Q2= (Median) Q3= 185 Chapter 2 BPS - 5th Ed. Chapter 2
 Q3= 185. Chapter 2. BPS - 5th Ed. Chapter 2.")
12
Weight Data: Quartiles
Basic Practice of Statistics - 3rd Edition 11 009 14 08 16 555 19 245 20 3 21 025 22 0 23 24 25 26 0 Weight Data: Quartiles first quartile median or second quartile third quartile BPS - 5th Ed. Chapter 2 Chapter 2

13
Basic Practice of Statistics - 3rd Edition
Five-Number Summary minimum = 100 Q1 = 127.5 M = 165 Q3 = 185 maximum = 260 Interquartile Range (IQR) = Q3 Q1 = 57.5 Range of the middle 50% of the distribution IQR gives spread of middle 50% of the data Chapter 2 BPS - 5th Ed. Chapter 2
 = Q3 Q1. = Range of the middle 50% of the distribution. IQR gives spread of middle 50% of the data. Chapter 2. BPS - 5th Ed. Chapter 2.")
14
Ex. 4 Given the sorted weights of 30 female athletes, find the three Quartiles: (1) There are 30 values in the sample: n=30 94 101 105 107 108 109 110 112 113 115 119 123 124 127 130 135 136 141 148 149 150 156 160 162 163 Q1 is the value at, or right above the value in the position (0.25)30: Since there is no position 7.5, we round 7.5 up to the next whole number 8. Then Q1 is the value in 8th position : (3) Q2 is the value in the middle of the 30 values: 15 is a whole number, therefore Q2 ( the median value) is half-way between 15th and 16th values of the data set: (4) Q3 is the value in position: or the value in the 23rd position:
30: Since there is no position 7.5, we round 7.5 up to the next. whole number 8. Then Q1 is the value in 8th position : (3) Q2 is the value in the middle of the 30 values: 15 is a whole number, therefore Q2 ( the median value) is. half-way between 15th and 16th values of the data set: (4) Q3 is the value in position: or the value in the 23rd position:")
15
Percentiles Just as there are three quartiles separating data into four parts, there are 99 percentiles denoted P1, P2, P99, which partition the data into 100 groups. If the position of the given percentile is a whole number, the data value that corresponds to this percentile is half-way between the value in this position and the next value. If the position of the given percentile is a decimal number, round it up to the next whole number. The data value that corresponds to this percentile is in that position.

16
Finding the value of a percentile:
Ex. 5 Find the 90th percentile of the given sorted weights of the 30 female athletes: 94 101 105 107 108 109 110 112 113 115 119 123 124 127 130 135 136 141 148 149 150 156 160 162 163 P90 is the value of the set that is the 90th percentile of the set, and is therefore located at or right after position: Since 27 is a whole number, P90 is the value that is half-way between the 27th and the 28th values of the set: 160 lb is the 90th percentile of the 30 female athlete weights, meaning 90% of the sampled athletes weigh less than 160 lbs.

17
Finding the percentile of a value:
Ex. 6 What percentile is 135 in this set of values? 127 130 135 136 141 148 149 150 156 135 is value which is higher than 3 values of the sorted set. Total number of values in this data set is 11. The proportion of all values of this set that are lower than 135 is then: 135 lbs is 27th percentile of this data set, meaning that 27% of values in the data set are less than 135 lbs.

18
DESIL Bilangan yang membagi data menjadi 10 bagian yang sama
Sehingga dalam 10 data terdapat 9 desil.

19
UKURAN PENYIMPANGAN X d 1 1 – 2 -1 0 – 2 -2 6 6 – 2 +4 1 - 2

20
DEVIASI RATA-RATA

21
Jika dicari nilai mutlak untuk deviasi rata-rata

22
Deviasi rata-rata data yang dikelompokan

23
DEVIASI STANDAR Adalah standar penyimpangan data dari rata-ratanya

24
(x - x)2 s = n - 1 n(x2) - (x)2 s = n (n - 1)
Standard Deviation in a Sample: (x - x)2 n - 1 s = shortcut formula for the SD in a Sample (eliminates the need to know the mean): n (n - 1) s = n(x2) - (x)2
2. n - 1. s = shortcut formula for the SD in a Sample (eliminates the need to know the mean): n (n - 1) s = n(x2) - (x)2.")
25
Ex. 2 Given the following data on the amount of pocket money, in dollars, of 4 sampled individuals, find the sample SD: x 1 4 5 10 mean ẋ = 5 - 4 - 1 + 5 16 1 25 ∑ = 42 42 4 - 1 s = = 3.7 (1) Add a deviation column: (2) Add a column for the squares of the deviations: (3) Divide the sum of the squares of the deviations by the number of values decreased by 1, then take the square root Pocket money amounts, in dollars, in the sample are spread $3.7, on average, away from the mean amount of $5.
 Add a deviation column: (2) Add a column for the squares of the deviations: (3) Divide the sum of the squares of the deviations by the number of values decreased by 1, then take the square root. Pocket money amounts, in dollars, in the sample are spread $3.7, on average, away from the mean amount of $5.")
26
Standard Deviation in a Population:
Again: Standard Deviation in a Population: Standard Deviation in a Sample: division by (n-1) makes the Sample SD target the value of the Population SD closer and is necessitated by reasons studied in later statistics classes.
 makes the Sample SD target the value of the Population SD closer and is necessitated by reasons studied in later statistics classes.")
27
Deviasi standar untuk data dikelompokan

28
Some more definitions:
Variance is the square of the Standard Deviation : in a sample: In a Population: Range is the difference between the maximum value and the minimum value in the set:

30
Any Queries ?

Presentasi serupa


>")


>")


>")


