Upload presentasi
Presentasi sedang didownload. Silahkan tunggu

1
ALIRAN DAN NERACA ENERGI, AIR, HARA DAN KOMODITAS PADA PERTANIAN TERPADU (2)
")
2
1990 Farm Bill defined “Sustainable Agriculture"
Under that law, "the term sustainable agriculture means an integrated system of plant and animal production practices having a site-specific application that will, over the long term: satisfy human food and fiber needs (not only, to be criticized) enhance environmental quality and the natural resource base upon which the agricultural economy depends make the most efficient use of nonrenewable resources and on- farm resources and integrate, where appropriate, natural biological cycles and controls sustain the economic viability of farm operations enhance the quality of life for farmers and society as a whole”.
 enhance environmental quality and the natural resource base upon which the agricultural economy depends. make the most efficient use of nonrenewable resources and on- farm resources and integrate, where appropriate, natural biological cycles and controls. sustain the economic viability of farm operations. enhance the quality of life for farmers and society as a whole .")
3
I. Basic Concepts (Antle, 2005)
Land use & management practices increase or decrease ecosystem C (key indicator of soil health)
")
4
Sistem pertanian organik -sumber input utama adalah bahan organik
-CHO dari air dan matahari -Hara dari dekomposisi materi organik: sisa tumbuhan, rambut, tulang, darah -sistem tertutup: tertutup untuk input dari luar: barier, rembesan air tanah, aliran air irigasi, bahan non organik dan organik dari tempat lain -pasar tersendiri -sertifikasi

5
(Safuan, et al. 2002) Agroforestry memasok % pemasukan dari pertanian di pedesaan melalui produksi langsung dan kegiatan lain yang berhubungan dengan pengumpulan, pemrosesan dan pemasaran hasilnya . Contoh kegiatan tersebut misalnya adalah aktivitas penanaman hutan dengan sistem tumpangsari, kegiatan penebangan, aktivitas angkutan hasil hutan, pembinaan industri rakyat, pembinaan sutra alam, lebah madu dan sebagainya (DS Fattah, 1999). Tabel Perincian Pendapatan Rata-rata Petani per Tahun per Hektar menurut Jenis Tanaman di Kebun Campuran Selama Tahun (Riva ,1998). Strata Pendapatan Rata-rata (Rp/th/ha) Jumlah Bambu T. Pokok T. Kebun T. Buah Palawija I II 21.052 III Rata-rata 95.362 Fattah, A Strategi Pengelolaan Hutan Indonesia Sebagai Amanah. Pola Aneka Sejahtera. Riva,W.F., Pengelolaan Kebun Campuran Tradisional dan Kontribusinya Terhadap Pendapatan Rumah Tangga. Studi Kasus di Kampung Naga Salawu Jawa Barat. Dalam Kehutanan Masyarakat Beragam Pola Partisipasi Masyarakat Dalam Pengelolaan Hutan. IPB dan The Ford Foundation. Hal. 37– 47.
. Tabel 2. Perincian Pendapatan Rata-rata Petani per Tahun per Hektar menurut Jenis Tanaman di Kebun Campuran Selama Tahun (Riva ,1998). Strata. Pendapatan Rata-rata (Rp/th/ha) Jumlah. Bambu. T. Pokok. T. Kebun. T. Buah. Palawija. I II III Rata-rata Fattah, A Strategi Pengelolaan Hutan Indonesia Sebagai Amanah. Pola Aneka Sejahtera. Riva,W.F., Pengelolaan Kebun Campuran Tradisional dan Kontribusinya Terhadap Pendapatan Rumah Tangga. Studi Kasus di Kampung Naga Salawu Jawa Barat. Dalam Kehutanan Masyarakat Beragam Pola Partisipasi Masyarakat Dalam Pengelolaan Hutan. IPB dan The Ford Foundation. Hal. 37– 47.")
6
Issue Negatif terkoreksi oleh Pertanian Terpadu:
Pencemaran limbah (kotoran, bau, pencemaran badan-air) Eutrifikasi pada air P>0.03 ppm, N>50 ppm Penguapan NH3 dari kandang dan penggembalaan ternak Efisiensi penggunaan pupuk N (Slide no. 11energi Fossil dan Efisiensi energi (M.B. Santoso, 2005, terutama 80% dari N dan Pestisida). 15-20% pencemaran gas rumah kaca dunia oleh metan bersumber dari padi sawah. Usaha pengurangan fluks metan (2 (tanah debu) – 40 (tanah liat) mg m−2 h−1 CH4 : pemberian Fe3+, pengaturan air (kadang dikeringkan), aplikasi (Fe3+, pupuk fosfat, silikat, ZA, Nitrat) dapat menekan 20% fluks. Pengembalian jerami dan pemberian pupuk hijau di tanah sawah meningkatkan emisi CH4. Peningkatan emisi CH4 pada sistem kombinasi padi-ikan. Akumulasi nitrat 4000 – ppm pada pucuk daun tanaman muda (sayuran, langsung tanpa proses melalui buah-biji), terutama tanaman dengan minimal pencahayaan/di bawah naungan. Peningkatan penyerapan logam berat oleh penggunaan kompos dari sisa tumbuhan
 Eutrifikasi pada air P>0.03 ppm, N>50 ppm. Penguapan NH3 dari kandang dan penggembalaan ternak. Efisiensi penggunaan pupuk N (Slide no. 11energi Fossil dan Efisiensi energi (M.B. Santoso, 2005, terutama 80% dari N dan Pestisida) % pencemaran gas rumah kaca dunia oleh metan bersumber dari padi sawah. Usaha pengurangan fluks metan (2 (tanah debu) – 40 (tanah liat) mg m−2 h−1 CH4 : pemberian Fe3+, pengaturan air (kadang dikeringkan), aplikasi (Fe3+, pupuk fosfat, silikat, ZA, Nitrat) dapat menekan 20% fluks. Pengembalian jerami dan pemberian pupuk hijau di tanah sawah meningkatkan emisi CH4. Peningkatan emisi CH4 pada sistem kombinasi padi-ikan. Akumulasi nitrat 4000 – ppm pada pucuk daun tanaman muda (sayuran, langsung tanpa proses melalui buah-biji), terutama tanaman dengan minimal pencahayaan/di bawah naungan. Peningkatan penyerapan logam berat oleh penggunaan kompos dari sisa tumbuhan.")
7
Penggunaan bioagent : Biofertilizer
Fungi Mikoriza Arbuskular, Infeksi nodulasi nitrobakter Preparat Alga untuk mobilisasi dan fiksasi N dan peningkatan aktivitas biologi tanah Spora bakteri tanah Coniothyrium mintans melawan Sclerotinia sclerotiorum (1 g=10 exp 9 spora) -3 tahun (contans wg) BioAct® Paecilomyces lilacinus, Line251 untuk melawan Meloidogyne spp. , Heterodera spp., Globodera spp. Pratylenchulus spp. Pheromon Agen alelopati
 -3 tahun (contans wg) BioAct® Paecilomyces lilacinus, Line251 untuk melawan Meloidogyne spp. , Heterodera spp., Globodera spp. Pratylenchulus spp. Pheromon. Agen alelopati.")
8
Pertumbuhan pohon turi (Sesbania grandifolia) 4 bulan
Dengan mikoriza pada lahan pasca tambang b (Purwoto, et al. 2004) a b a +AM fungi Diameter (mm) control Control AM fungi
 a. b. a. +AM fungi. Diameter (mm) control. Control. AM fungi.")
9
137 132 Ilustrasi Pola Tanam Padi-Padi-Padi (hipotetik)
(bagaimana setelah 10, 20, 50 tahun ditinjau dari status humus tanah, energi.N, P, K, ……..) ton/ha kg/ha Nitrogen I II III Sumber Input Pupuk 120 Sistem sawah N-alami 25 (Pustaka) Hujan 10 5 Terangkut Gabah 8% protein 8 -5 Jerami 1,4 % prot 15 -13 Total N disediakan 155 150 Total N terangkut -18 N Hilang 137 132 (kemana, distribusi) Efisiensi %
 ton/ha. kg/ha. Nitrogen. I. II. III. Sumber. Input. Pupuk Sistem sawah. N-alami. 25. (Pustaka) Hujan Terangkut. Gabah. 8% protein Jerami. 1,4 % prot Total N disediakan Total N terangkut N Hilang (kemana, distribusi) Efisiensi %")
10
Antle (2005) newfarm.org/depts/NFfield_trials/1003/carbonsequest.shtml
 newfarm.org/depts/NFfield_trials/1003/carbonsequest.shtml")
11
Bebarapa Ilustrasi Sistem pertanian Terpadu
Gagasan (Horisontal) Suprapto (2004) menjelaskan, dalam pelaksanaan sistem pertanian terpadu setidaknya petani minimal memiliki lahan seluas 1000 meter persegi. Dengan modal Rp juta, maka di lahan tersebut mereka bisa beternak itik seratus ekor, kambing sebanyak lima ekor, beternak ikan, dan menanam padi. Pembagian lahannya, 10 persen untuk ternak, 20 persen untuk sayur, 10 persen untuk ikan dan 60 persen untuk padi. Kalau pemerintah punya anggaran, ini bisa dilakukan dengan memberikan pinjaman bergulir, juga perbankan kalo bisa memberi pinjaman yang sangat lunak. Tapi itu pun jika mereka memang betul-betl peduli dengan petani. Konsep pertanian terpadu ini, sedikitnya penghasilan petani setiap bulan ditaksir 820 ribu perbulan, artinya dengan empat orang anggota keluarga akan mencukupi. Suprapto menerangkan bahwa hasil panen padi ini bisa mencapai 11,2 ton per hektar dengan metode sistem padi sri melalui penggunaan pupuk organik. Sedangkan pengelolaan tanah, bibit, pengendalian hama terpadu, dilakukan tanpa menggunakan bahan non kimia.
 Suprapto (2004) menjelaskan, dalam pelaksanaan sistem pertanian terpadu setidaknya petani minimal memiliki lahan seluas 1000 meter persegi. Dengan modal Rp juta, maka di lahan tersebut mereka bisa beternak itik seratus ekor, kambing sebanyak lima ekor, beternak ikan, dan menanam padi. Pembagian lahannya, 10 persen untuk ternak, 20 persen untuk sayur, 10 persen untuk ikan dan 60 persen untuk padi. Kalau pemerintah punya anggaran, ini bisa dilakukan dengan memberikan pinjaman bergulir, juga perbankan kalo bisa memberi pinjaman yang sangat lunak. Tapi itu pun jika mereka memang betul-betl peduli dengan petani. Konsep pertanian terpadu ini, sedikitnya penghasilan petani setiap bulan ditaksir 820 ribu perbulan, artinya dengan empat orang anggota keluarga akan mencukupi. Suprapto menerangkan bahwa hasil panen padi ini bisa mencapai 11,2 ton per hektar dengan metode sistem padi sri melalui penggunaan pupuk organik. Sedangkan pengelolaan tanah, bibit, pengendalian hama terpadu, dilakukan tanpa menggunakan bahan non kimia.")
13
Bebarapa Ilustrasi Sistem pertanian Terpadu
B. Gagasan (vertikal): 1. AGROTECNOPARK: merupakan kawasan untuk memfasilitasi percepatan ahli teknologi yang dihasilkan oleh lembaga litbang pemerintah, perguruan tinggi dan swasta yang sekaligus sebagai model percontohan pertanian terpadu bersiklus biologi (bio-cyclo farming). Klaster inovasi yang terdiri dari komponen-komponen pendukung yaitu pasokan teknologi (Lembaga); Industri pemasok pendukung (lahan, benih, pupuk, pestisida, dll); finansial ; industri/pasar/masyarakat dan regulasi (PEMDA, Pemerintah Pusat). Strategi : keterpaduan berbagai usaha tanihulu-hilir, kemandirian bisnis dan iptek, keberlanjutan sumber daya, pemberdayaan masyarakat serta total iptek 2. AGROPOLITAN: Friedmann dan Mc.Doughlas (1974) sebagai suatu siasat untuk percepatan pembangunan perdesaan : pembangunan dalam arti luas, seperti redistribusi tanah, kesesuaian lahan, mendesain tata guna lahan dan pembangunan sarana dan prasarana. (1). Produksi dengan bobot sektor pertanian; (2). Prinsip ketergantungan dengan aktivitas pertanian sehingga neuro- systemnya; (3) Prinsip pengaturan kelembagaan; (4). Prinsip seimbang dinamis.
: 1. AGROTECNOPARK: merupakan kawasan untuk memfasilitasi percepatan ahli teknologi yang dihasilkan oleh lembaga litbang pemerintah, perguruan tinggi dan swasta yang sekaligus sebagai model percontohan pertanian terpadu bersiklus biologi (bio-cyclo farming). Klaster inovasi yang terdiri dari komponen-komponen pendukung yaitu pasokan teknologi (Lembaga); Industri pemasok pendukung (lahan, benih, pupuk, pestisida, dll); finansial ; industri/pasar/masyarakat dan regulasi (PEMDA, Pemerintah Pusat). Strategi : keterpaduan berbagai usaha tanihulu-hilir, kemandirian bisnis dan iptek, keberlanjutan sumber daya, pemberdayaan masyarakat serta total iptek. 2. AGROPOLITAN: Friedmann dan Mc.Doughlas (1974) sebagai suatu siasat untuk percepatan pembangunan perdesaan : pembangunan dalam arti luas, seperti redistribusi tanah, kesesuaian lahan, mendesain tata guna lahan dan pembangunan sarana dan prasarana. (1). Produksi dengan bobot sektor pertanian; (2). Prinsip ketergantungan dengan aktivitas pertanian sehingga neuro- systemnya; (3) Prinsip pengaturan kelembagaan; (4). Prinsip seimbang dinamis.")
14
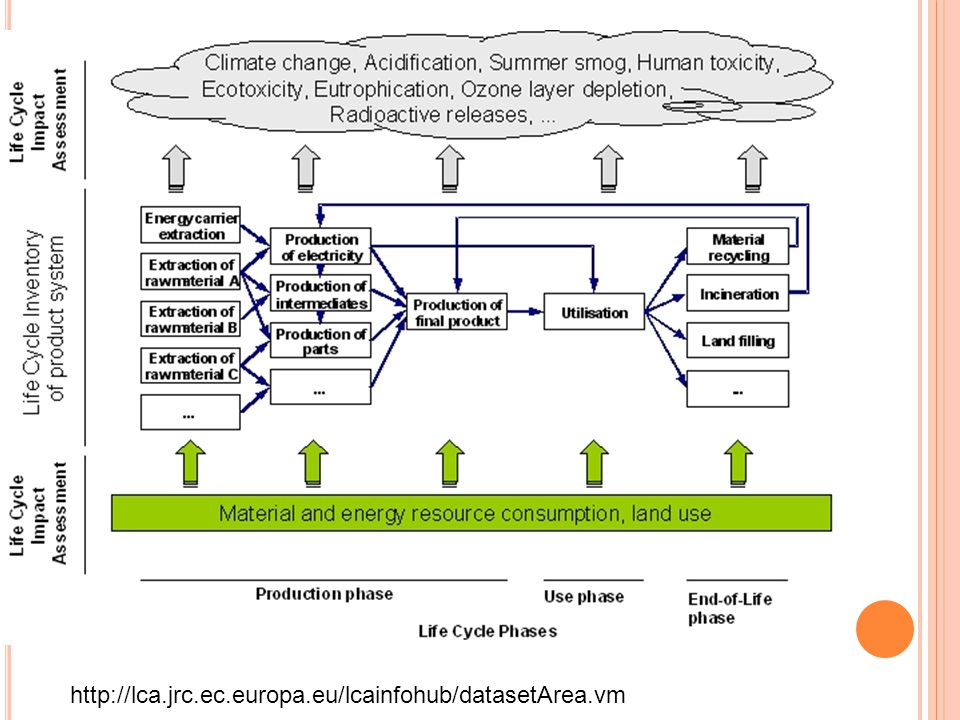
Life Cycle Assessment (LCA)
A life cycle assessment (also known as life cycle analysis, life cycle inventory, ecobalance, cradle-to-grave-analysis, well-to-wheel analysis, and dust-to-dust energy cost) is the assessment of the environmental impact of a given product or service throughout its lifespan. Life cycle energy analysis Life cycle energy analysis (LCEA) is an approach in which all energy inputs to a product are accounted for, not only direct energy inputs during manufacture, but also all energy inputs needed to produce components, materials and services needed for the manufacturing process. An earlier term for the approach was energy analysis. With LCEA, the total life cycle energy input is established.
 is the assessment of the environmental impact of a given product or service throughout its lifespan. Life cycle energy analysis. Life cycle energy analysis (LCEA) is an approach in which all energy inputs to a product are accounted for, not only direct energy inputs during manufacture, but also all energy inputs needed to produce components, materials and services needed for the manufacturing process. An earlier term for the approach was energy analysis. With LCEA, the total life cycle energy input is established.")
16
Life Cycle Analysis of Sugar Cane Packaging
After 4 weeks - After 8 weeks of incubation

17
From: UNEP Sustainable Agri-Food Production and Consumption Forum

18
Table 4 Potential impacts in the cropping systems for a 40-year cultivation period (Kim, Dale, 2005) Unit Corn-Soybean Corn-Corn Corn-Wheat Nonrenewable energy GJ ha Global warming impact kg CO2 eq. ha1 23, , ,984 Acidification moles H+ eq. ha , , ,482 Eutrophication kg N eq. ha

19
FIN

20
CH4 (sawah) : Total CH4 emission was decreased by 16–20% with 4 Mg ha−1 silicate fertilizer (Alia, Ohb and Kim, 2008) Methane is the second most important greenhouse gas after carbon dioxide. Rice paddy soils release approximately 15–20% of total methane emitted to the atmosphere.. A 1-week drainage of a rice field during the growing season could further reduce the methane emission by 22–23% and might be a very promising methane-emission mitigation technique, since such drainage practices can also conserve water and improve rice yields. Application of nitrate fertilizer at a rate of 64 kg N/ha (about 50% of total nitrogen applied at the Chongqing site) could reduce methane emission by 7%.(Xu, Jafféb and Mauzerall, 2007) Secondly, the soil redox matter content and methanogenic bacteria population of the rice -duck ecosystem reduced more sharply than those of the no-duck rice farming, resulting in a lower methane production. (Zhiqiang, et al. 2008) Higher seasonal integrated methane flux was recorded Esif = 0.96 g m−2 - 1.38 g m− Cultural practices may account for 20% of the overall seasonal CH4 emissions. estimates of annual CH4 emission from ricefields is 100 Tg. CH4 emission (Neue, et al, 1996) Soil type also had a significant effect on CH4 emissions during the flooded season, over which the weighted average flux was 111 mg C m−2 h−1 and 2.2 mg C m−2 h−1 from Clay and Loess, respectively (XIONG, XINGa and ZHU, 2007). The CH4 emission decreased with increases in AS application rate, caused by competition for substrates between sulfate-reducing bacteria and methanogens. Decreases in soil redox potential (Eh) were delayed with increases in AS application rate. (Minamikawa, Sakai and Hayashi, 2004) Methane emissions were quite high and reached a maximum of >20 mg m−2 h−1 in all treatments, 34–40 days after flooding. Presence of fish tended to boost methane emission (Frei and K. Becker, 2004) The highest emission occurred at the full tillering stage of late rice with a rate of 24.1 or 32.2 or 40.5 mg m−2 h−1 in no-tillage area with duck and no-tillage area without duck and conventional-tillage area without duck, respectively.( XIANG et al. 2006) It was concluded that higher concentration of copper in the soils resulted in lower soil DOC and thus reduced CH4 emission when there was no additional organic matter input. Incorporation of wheat straw did not affect soil DOC and available copper concentration but enhanced CH4 emission. Seasonal average rate of CH4 emission from different soils ranged from 1.96 to mg m−2 h−1 in the 2000 experiment, and from to 5.92 mg m−2 h−1 for the MF treatment in the 2001 experiment, respectively. Incorporation of wheat straw enhanced considerably CH4 emission with an average increment of 7.09 mg m−2 h−1. (Huang et al, 2004) Sesbania amendment stimulated methane emission and the effect was more significant at the early growth stage of rice. Methane emission was higher in continuous flooding treatment than that in intermittent irrigation (Yang and Chang, 2000). The total methane emission during the vegetation period of rice was reduced by 43% and 84%, with the addition of 15 and 30 g of ferrihydrite per kg of soil, respectively(Jäckel and Schnell, 2000) phosphorus applied as single superphosphate (SSP) distinctly inhibited CH4 emission from a flooded field plot planted to rice.(Adhya, et al )
 could reduce methane emission by 7%.(Xu, Jafféb and Mauzerall, 2007) Secondly, the soil redox matter content and methanogenic bacteria population of the rice -duck ecosystem reduced more sharply than those of the no-duck rice farming, resulting in a lower methane production. (Zhiqiang, et al. 2008) Higher seasonal integrated methane flux was recorded Esif = 0.96 g m− g m− Cultural practices may account for 20% of the overall seasonal CH4 emissions. estimates of annual CH4 emission from ricefields is 100 Tg. CH4 emission (Neue, et al, 1996) Soil type also had a significant effect on CH4 emissions during the flooded season, over which the weighted average flux was 111 mg C m−2 h−1 and 2.2 mg C m−2 h−1 from Clay and Loess, respectively (XIONG, XINGa and ZHU, 2007). The CH4 emission decreased with increases in AS application rate, caused by competition for substrates between sulfate-reducing bacteria and methanogens. Decreases in soil redox potential (Eh) were delayed with increases in AS application rate. (Minamikawa, Sakai and Hayashi, 2004) Methane emissions were quite high and reached a maximum of >20 mg m−2 h−1 in all treatments, 34–40 days after flooding. Presence of fish tended to boost methane emission (Frei and K. Becker, 2004) The highest emission occurred at the full tillering stage of late rice with a rate of 24.1 or 32.2 or 40.5 mg m−2 h−1 in no-tillage area with duck and no-tillage area without duck and conventional-tillage area without duck, respectively.( XIANG et al. 2006) It was concluded that higher concentration of copper in the soils resulted in lower soil DOC and thus reduced CH4 emission when there was no additional organic matter input. Incorporation of wheat straw did not affect soil DOC and available copper concentration but enhanced CH4 emission. Seasonal average rate of CH4 emission from different soils ranged from 1.96 to mg m−2 h−1 in the 2000 experiment, and from 0.89 to 5.92 mg m−2 h−1 for the MF treatment in the 2001 experiment, respectively. Incorporation of wheat straw enhanced considerably CH4 emission with an average increment of 7.09 mg m−2 h−1. (Huang et al, 2004) Sesbania amendment stimulated methane emission and the effect was more significant at the early growth stage of rice. Methane emission was higher in continuous flooding treatment than that in intermittent irrigation (Yang and Chang, 2000). The total methane emission during the vegetation period of rice was reduced by 43% and 84%, with the addition of 15 and 30 g of ferrihydrite per kg of soil, respectively(Jäckel and Schnell, 2000) phosphorus applied as single superphosphate (SSP) distinctly inhibited CH4 emission from a flooded field plot planted to rice.(Adhya, et al. 1999)")
21
NH3 Annual NH3–N emission rate was 4430 kg NH3–N d−1, which was 53% of the N fed to cattle. Ammonia emission rates and emission factors for a 77-ha, 45 000-head commercial beef cattle feedyard (Todd, et al., 2008) The uncertainty range for the global NH3 emission from agricultural systems is 32 Tg NH3-N yr−1, N fertilizer use contributing 11 Tg yr−1 and livestock production 21 Tg yr−1. Most of the emissions from livestock production come from animal houses and storage systems (31–55%); smaller contributions come from the spreading of animal manure (23–38%) and grazing animals (17–37%). (Beusen et al., 2008). NO3 >4000 – ppm pada pucuk daun tanaman muda (sayuran, langsung tanpa proses melalui buah-biji), terutama tanpa pencahayaan/di bawah naungan Logam berat Kelatisasi kompos dari tumbuhan Peningkatan serapan logam berat oleh tanaman oleh kompos tumbuhan (Greger et al., 2006)
 The uncertainty range for the global NH3 emission from agricultural systems is 32 Tg NH3-N yr−1, N fertilizer use contributing 11 Tg yr−1 and livestock production 21 Tg yr−1. Most of the emissions from livestock production come from animal houses and storage systems (31–55%); smaller contributions come from the spreading of animal manure (23–38%) and grazing animals (17–37%). (Beusen et al., 2008). NO3. >4000 – ppm pada pucuk daun tanaman muda (sayuran, langsung tanpa proses melalui buah-biji), terutama tanpa pencahayaan/di bawah naungan. Logam berat. Kelatisasi kompos dari tumbuhan. Peningkatan serapan logam berat oleh tanaman oleh kompos tumbuhan (Greger et al., 2006)")
Presentasi serupa


 • Produksi padi, pada tahun 2007 mencapai 57,05 juta ton gabah kering giling (GKG) atau mengalami peningkatan dari tahun sebelumnya.>")


” Oleh : Septia.>")


>")


