Upload presentasi
Presentasi sedang didownload. Silahkan tunggu

1
Statistik TP A Pengujian Hipotesis Satu Populasi (Mean dan Proporsi) Nurvita Arumsari, Ssi, Msi Rahandini Lukita, Ssi, Msi, MSc

2
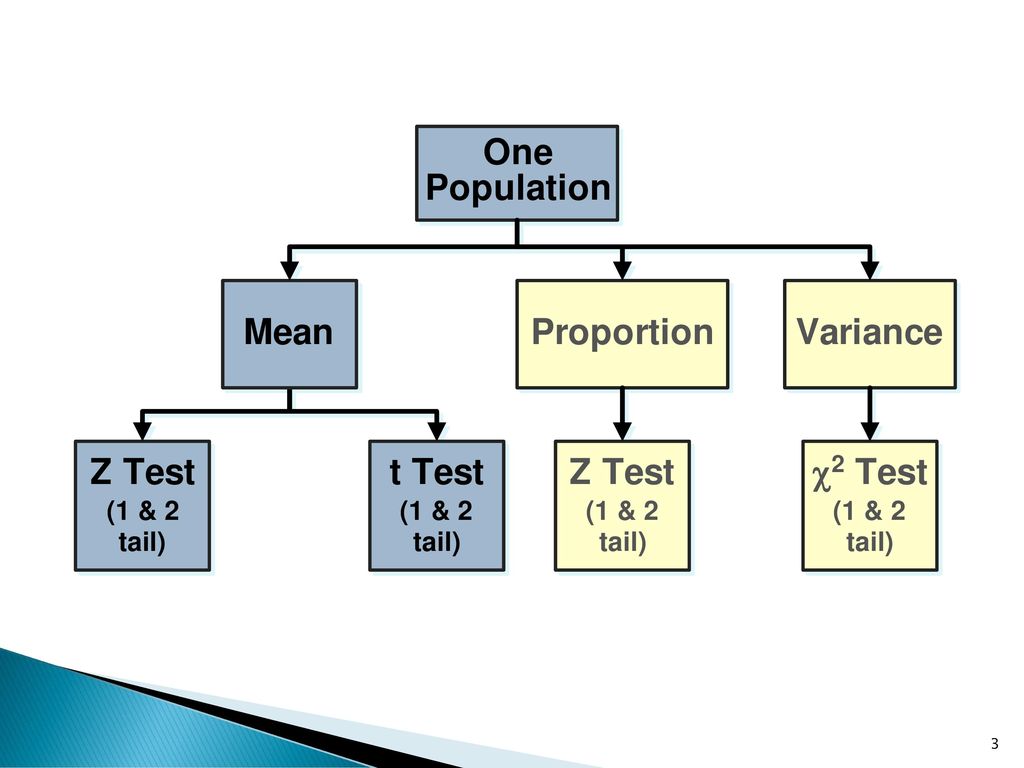
One – Sample Mean Population Test

4
Testing For The Population Mean (1)
Hypothesis Tests for μ Known Unknown The test statistic is: Large Samples Small Samples

5
Testing For The Population Mean (2)
Hypothesis Tests for Known Unknown The test statistic is: But is sometimes approximated using a z: Large Samples Small Samples

6
Testing For The Population Mean (3)
(continued) Hypothesis Tests for Known Unknown The test statistic is: Large Samples Small Samples (The population must be approximately normal)
 Hypothesis. Tests for Known. Unknown. The test statistic is: Large. Samples. Small. Samples. (The population must be approximately normal)")
7
Test satu arah untuk Mean ( σ Diketahui)
Asumsi Populasi berdistribusi normal Jika tak normal perlu sampel besar Tanda H0 ≤ atau ≥ , H1 > atau < Hipotesis Z Statistik uji H0: m ³ m0 H1: m < m0 H0: m £ m0 H1: m > m0 H0: m = m0 H1: m ≠ m0

8
Daerah Kritis Tolak H0 Tolak H0 Z Z H0: m ³ m0 H1: m < m0
Z Nilai Z yang kecil tidak kontradiksi dengan H0 gagal tolak H0 Z harus secara Significant dibawah 0 untuk menolak H0

9
Example Apakah rata2 berat cereal kurang dari gram ? Sampel random dari 25 kotak cereal rata-rata = Dengan s 15 gram. Lakukan test pada a = 368 gm. H0: m ≥ H1: m < 372.5

10
Penyelesaian Test Statistic: Putusan: Kesimpulan: Z
H0: m ≥ H1: m < Test Statistic: Putusan: Kesimpulan: a = 0.05 n = 25 Nilai Kritis : 1.645 Gagal tolak H0 di a = .05 Tolak .05 Rata-rata berat cereal minimal sama dengan 368 -1.645 Z -1.50

11
Pendekatan p-value Convert Sample Statistic to Test Statistic ( Z or t statistic ) Obtain the p-value from a table or computer Compare the p-value with If p-value < , reject H0 If p-value , do not reject H0

12
p-value example = .05 p-value =.0668 x 368 372.5

13
p-value example Compare the p-value with Here: p-value = .0668
(continued) Compare the p-value with If p-value < , reject H0 If p-value , do not reject H0 = .05 Here: p-value = .0668 = .05 Since > .05, we accept the null hypothesis p-value =.0668 386 372.5
 Compare the p-value with If p-value < , reject H0. If p-value , do not reject H0. = .05. Here: p-value = = .05. Since > .05, we accept the null hypothesis. p-value =")
14
Example: Tes Dua Arah untuk mean
Does an average box of cereal contain 368 grams of cereal? A random sample of 25 boxes showedX = The company has specified s to be 15 grams. Find the p-Value. 368 gm.

15
Penyelesaian Test Statistic: Putusan: Kesimpulan: Z
H0: m = H1: m ≠ 368 Test Statistic: Putusan: Kesimpulan: a/2 = 0.025 n = 25 Nilai Kritis : 1.96 Gagal tolak H0 di a = .05 Tolak .025 Rata-rata berat cereal sama dengan 368 1.96 Z -1.96 1.50

16
One – Sample Proportion Population Test

17
Tes untuk Proporsi Populasi
Proportion: A fraction or percentage that indicates the part of the population or sample having a particular trait of interest. The sample proportion is denoted by :

18
Uji Statistik untuk Proporsi Populasi

19
Example You’re an accounting manager. A year-end audit showed 4% of transactions had errors. You implement new procedures. A random sample of 500 transactions had 25 errors. Has the proportion of incorrect transactions changed at the .05 level?

20
One-Proportion Z Test Solution DuaArah
H0: P0= .04 H1: P0 .04 = .05 n = 500 Critical Value(s): Test Statistic: Decision: Conclusion: Do not reject at = .05 There is evidence proportion is still 4%
: Test Statistic: Decision: Conclusion: Do not reject at = .05. There is evidence proportion is still 4%")
21
Contoh Manajer produksi mengatakan tingkat kerusakan barang kurang dari 10%. Dari 40 sampel random yang diuji, 3 diantaranya rusak. Benarkah pendapat tersebut ? Gunakan tingkat keyakinan 1%

22
Contoh “6 dari 10 ABG di Surabaya merokok”, demikian pendapat Sosiolog. Hasil penelitian terhadap 100 sampel ABG, 65 diantaranya merokok. Uji pendapat tersebut dengan taraf signifikasi 5%

Presentasi serupa
>")


>")
 Pertemuan 14 Matakuliah: L0104 / Statistika Psikologi Tahun : 2008.>")


